


US Dollar News: USD Price Analysis and Charts.
- US dollar traders wait on the sidelines as NFPs near.
- Current USD weakness may accelerate if the supportive 200-day ma is broken decisively.
DailyFX Q2 Forecasts and Top 2019 Trading Opportunities.
US Dollar (DXY) Price Action Limited Ahead of Heavyweight US Data
The US dollar continues the trend of limited price action and volatility ahead of the monthly US Labour Report (NFPs). The report, including closely watched wages data, is a noted driver of USD activity and this month’s release has gained extra importance after Wednesday’s surprisingly weak ADP report. The ADP private job creation report showed US companies adding just 27k extra in May – a nine-year low – missing expectations of +183k and a prior month’s robust +271k. While the correlation between the two figures is not strong enough to draw any firm conclusions, Wednesday’s release has seen NFP market expectations pared back. Non-farm Payrolls are expected to show +174k new jobs compared to April’s reading of +236k. Average hourly earnings y/y are seen unchanged at 3.2%.
DailyFX senior analyst Chris Vecchio will be covering US NFPs live on Friday from 12.15 GMT.
The DailyFX Calendar is a comprehensive guide to all market moving data releases and events.
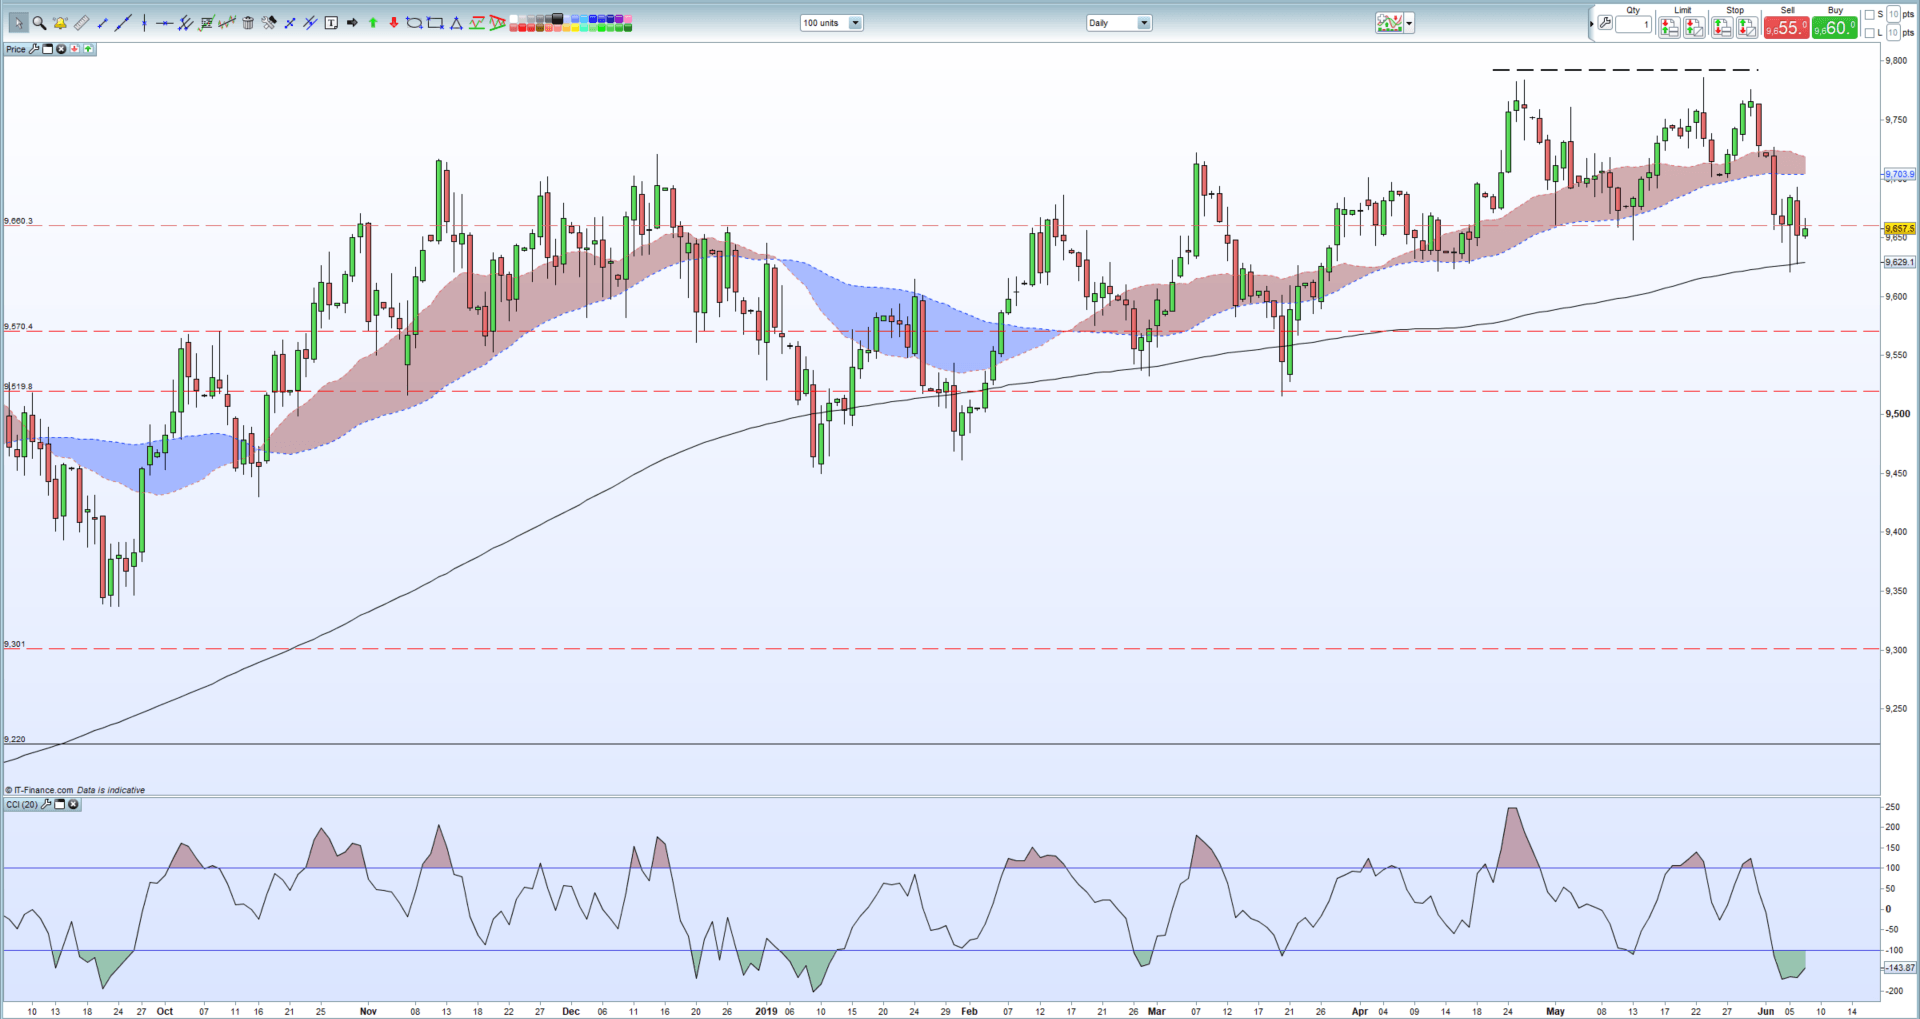
After making and then rejecting a double-top printed on April 26 and May 23, the US dollar has slipped lower as markets continue to price-in at least two 0.25% interest rate cuts in 2019. The US dollar basket (DXY) has found support recently from the 200-day moving average – currently at 96.28 - but a strong NFP miss may see this long-term technical indicator tested again. Below here, the 50% Fibonacci retracement at 95.87 before a potential re-trace back to the march 20 swing-low at 95.16. The recent sell-off has driven the greenback into oversold territory which may temper any sell-off in the near term.
US Dollar (DXY) Daily Price Chart (September 2018 – June 7, 2019)
IG Client Sentiment shows how retail traders are positioned in a wide range of asset classes and how daily and weekly sentiment changes can help drive momentum.
--- Written by Nick Cawley, Market Analyst
To contact Nick, email him at nicholas.cawley@ig.com
Follow Nick on Twitter @nickcawley1


