Gold Price/Silver Price, Analysis and Charts.
- Gold needs to fill the gap before the next leg higher, FOMC permitting.
- Silver struggling with technical resistance.
DailyFX Q2 USD and Gold Forecasts and Top 2019 Trading Opportunities.
Gold Rejects 14-Month High
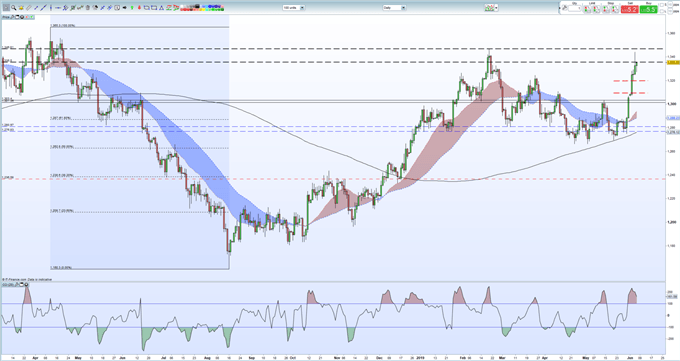
Gold’s latest rally took it to within $3/oz. of levels last seen in April 2018 as the precious metal continued to rally on the back of a weakening US dollar. Gold has rallied nearly $70/oz. – 5.4% - in a week and the market is currently edging lower. The next move in the precious metal will be predicated by Friday’s US Labor report (NFPs) with any weakness in the jobs report a positive for the precious metal. Wednesday’s US ADP employment change report rattled the US dollar, missing expectations by a wide margin – actual 27k vs 183k exp – and printing a nine-year low.
On the charts, gold may well look to fill the gap between $1,309/oz, and $1,320/oz. before any attempt to move higher. Below here there is a tight zone between $1,301 and $1,304/oz. that has provided supportive. To the upside, $1,346.8/oz. guards April 2018 high at $1,365/oz. a level that may well be tested if US NFPs miss expectations.
The CCI indicator shows that the market remains heavily overbought and may well slow any further upside in the short-term.
How to Trade Gold: Top Gold Trading Strategies and Tips
Gold (XAU) Daily Price Chart (March 2018 – June 6, 2019)

IG Client Sentiment shows that retail traders are 59.4% net-long gold, a bearish contrarian indicator. Recent daily and weekly sentiment shifts however give us a stronger bearish contrarian trading bias.
Silver Runs into Resistance
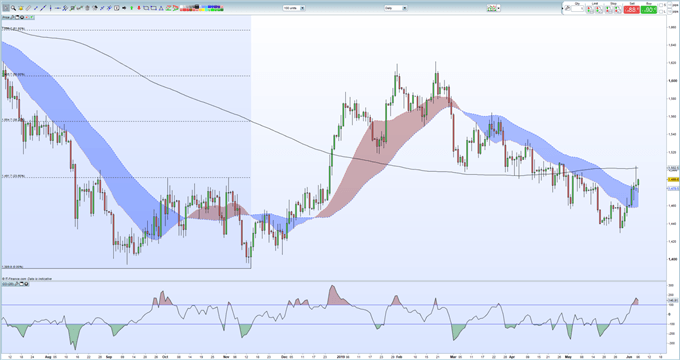
Silver traded above $15 yesterday but ran into heavy resistance from the 200-day moving average that has help sway since the start of May. Wednesday’s trading range was re-traced, and silver now trades around $14.89, below the 23.6% Fibonacci retracement level at $14.92 and the 200-day moving average at $15.02. The chart is flashing an overbought signal, but the recent series of lower highs has been broken, adding a positive longer-term spin. It may take a little longer for the chart s to confirm, or not, that silver is out of a bear market.
Silver Daily Price Chart (July 2018 – June 6, 2019)

Trading the Gold-Silver Ratio: Strategies and Tips
--- Written by Nick Cawley, Market Analyst
To contact Nick, email him at nicholas.cawley@ig.com
Follow Nick on Twitter @nickcawley1


