


Bitcoin (BTC) Price Outlook, Chart and Analysis:
- Bitcoin rallies to one-year high, volume picks-up.
- Support around $8,400 needs to hold.
IG Client Sentiment Data shows how retail are positioned in a variety of cryptocurrencies. See how daily and weekly positioning can affect our trading bias. Bitcoin (BTC) trade data shows 76.3% of traders are net-long, a strong contrarian bearish signal. However, recent daily and weekly changes in sentiment suggest a mixed trading bias.
A Guide to Day Trading Bitcoin and Other Cryptocurrencies.
Bitcoin (BTC) Rallies over the Long Weekend
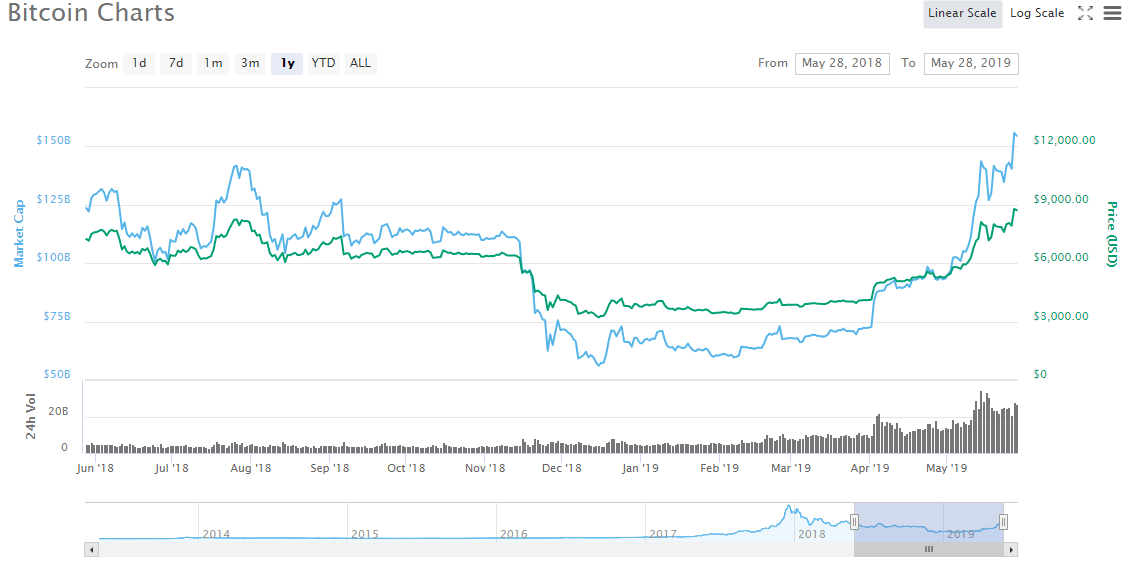
Another sharp move higher for the largest cryptocurrency (56.8% market dominance) with prices making a fresh one-year high and looking likely to move higher again. Increased turnover continues to back the validity of the move, pushing Bitcoin’s market capitalization back above $150 billion.
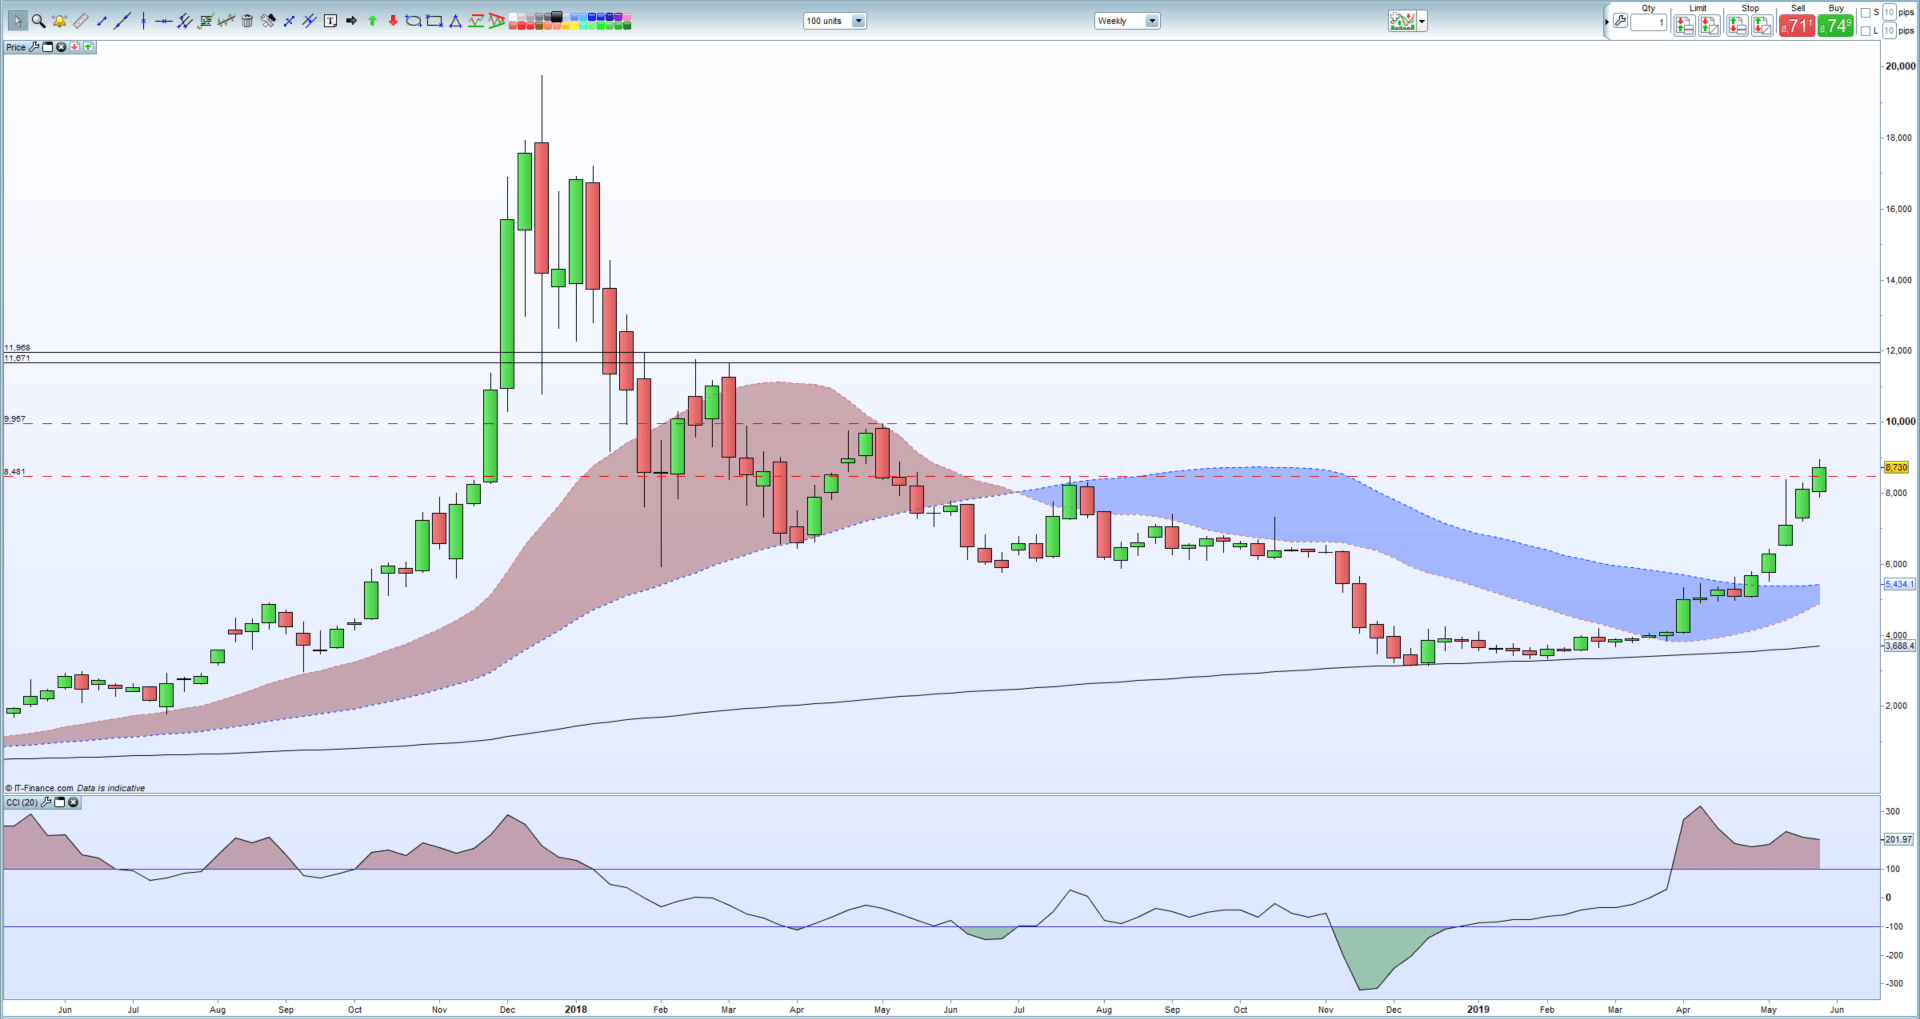
The weekly price chart continues to show Bitcoin in a positive light with the recent rally continuing unabated. The CCI indicator does show Bitcoin as heavily overbought, but the recovery from the December 2018 lows looks sustainable although a small sell-off in the short-term should not be discounted. The recent break above $8,481 needs to be consolidated and closed above on the weekly chart to allow bulls a run at $9,957, just ahead of the psychological level at $10,000. Above here, three previous highs between $11,670 and $11,968 will likely attract attention.
Bitcoin (BTC) Weekly Price Chart (May 2017 - May 28, 2019)
Traders may be interested in two of our trading guides – Traits of Successful Traders and Top Trading Lessons – while technical analysts are likely to be interested in our latest Elliott Wave Guide.
What is your view on Bitcoin (BTC) – bullish or bearish?? You can let us know via the form at the end of this piece or you can contact the author at nicholas.cawley@ig.com or via Twitter @nickcawley1.


