


S&P 500, Dow Jones, Nasdaq 100 Price Outlook:
- The S&P 500 plunged to Fibonacci support at 2,815 at Thursday’s open
- The blue-chip Dow Jones Industrial Average looks to test an area of support from 25,350 to 25,435
- Retail traders are overwhelmingly short the S&P 500, find out how to use IG Client Sentiment Data with one of our Live Sentiment Data Walkthroughs
S&P 500, Dow Jones, Nasdaq 100 Price Outlook
The three major US stock indices gapped lower at the open to start Thursday trading, a familiar sight as of late. Financial news media and analysts were quick to blame continued trade war fears for the rout, as the two sides cite stalled negotiations. Weak manufacturing and services data likely sparked additional concern. But unlike other recent equity turmoil, Thursday’s move was accompanied by a surge in risk-off assets, from the US Dollar to Gold. As the weekend approaches, here are the price levels to watch for each major equity index.
S&P 500 Price Outlook
After falling out of a rising wedge, the S&P 500 is testing a critical support trendline marked by the lows from March and May. Three Fib levels are also present in the area, offering significant support in the 2,811 to 2,815 range. Should the Index break beneath 2,811, traders can look for subsequent support at the psychological 2,800 level. An effort below 2,800 would mark the lowest level for the Index since late March. Should that occur, look for minor support around 2,785 – the lows from late March.
S&P 500 Price Chart: 1 – Hour Time Frame (April 15 – May 23) (Chart 1)
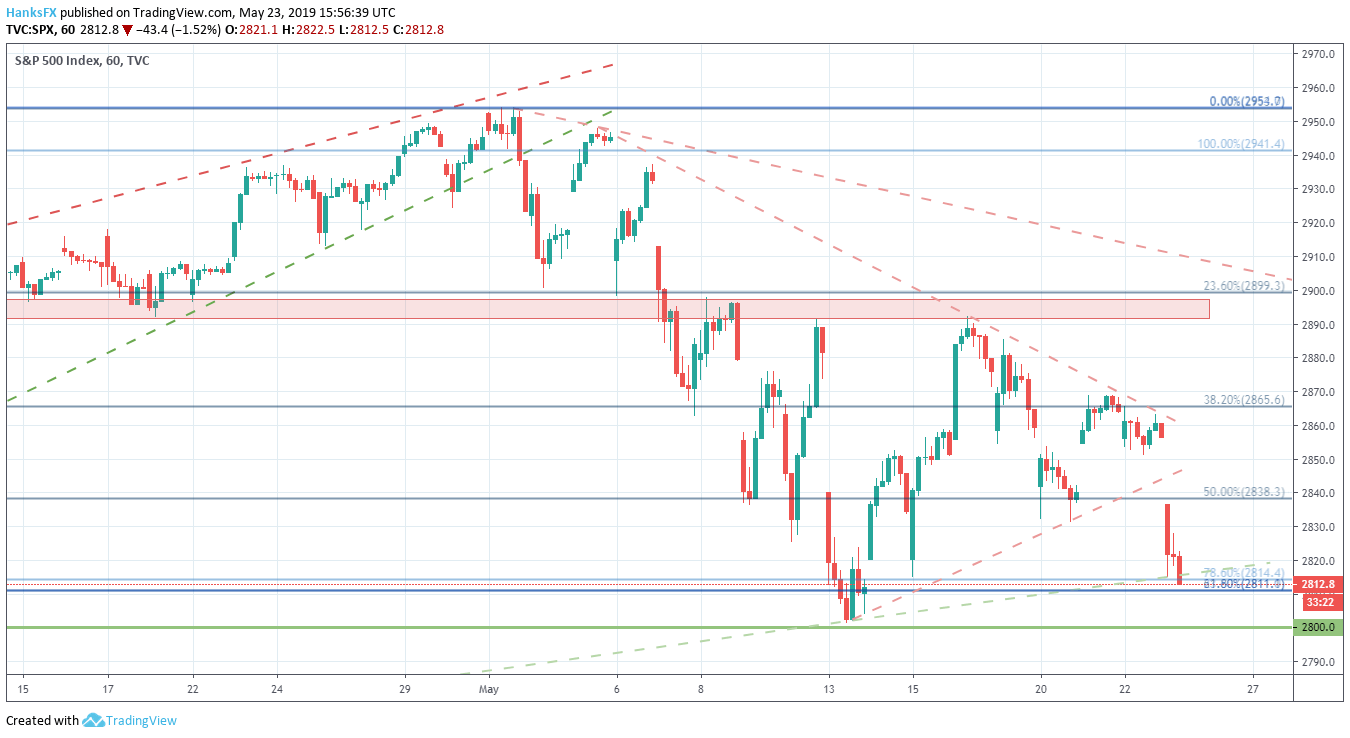
To the topside, the 50% Fib level at 2,838 and the lower bound of the rising wedge will pose resistance. Given the number of technical levels near the current trading price, the Index may trade indecisively as bulls and bears attempt to gauge the others commitment.
Dow Jones Price Outlook
Similarly, the Dow Jones Industrial Average fell out of its own wedge. After gapping lower, the Average quickly slipped to support from 25,350 to 25,435 which marks the lows from late-March and has provided buoyancy in May. A drive lower would open the door for the Index to test March’s low at 25,202.
Dow Jones Price Chart: 1 – Hour Time Frame (April 15 – May 23) (Chart 2)
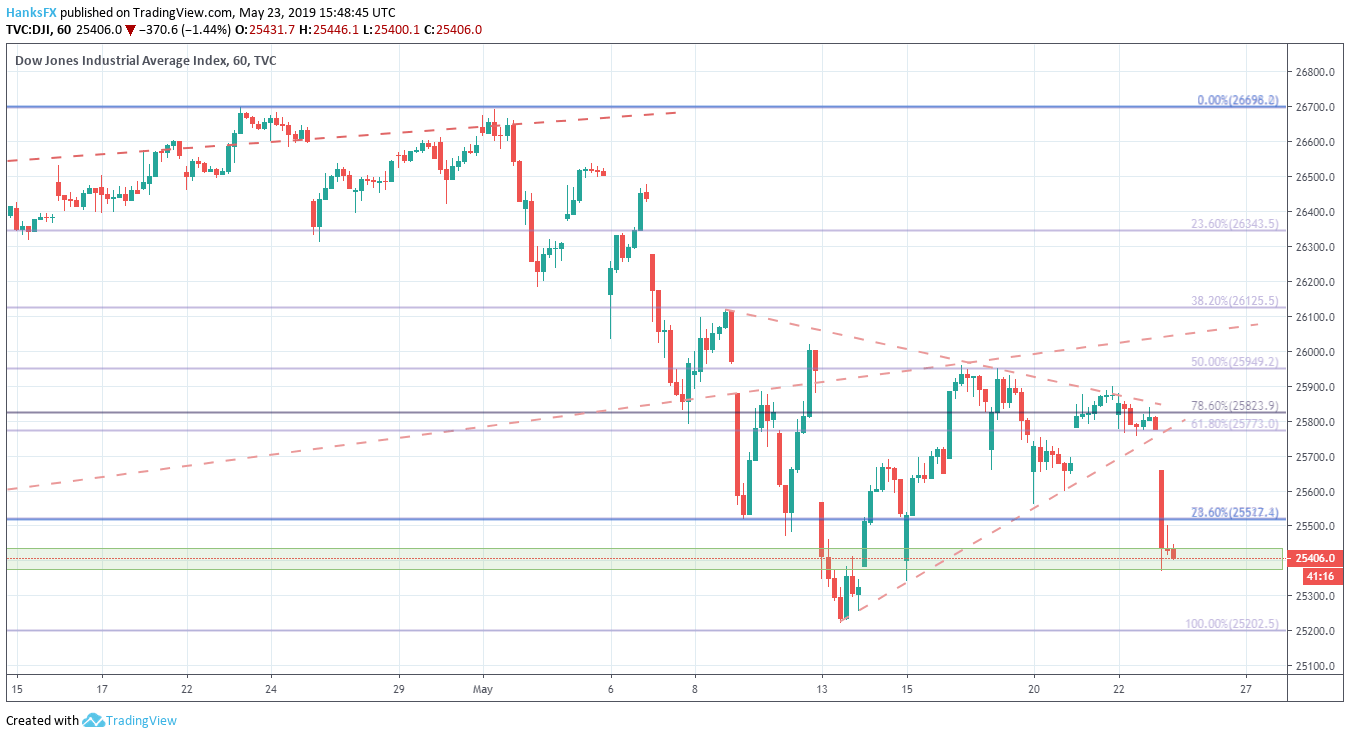
On a rebound to the topside, the Average must first retake 25,520 - a level which has given pause to rebounds in the past. Secondarily, the Index will face a confluence of resistance in the 25,770 to 25,825 area. For both the Dow Jones and the S&P 500, a daily close above Thursday lows and the support which they rest at is critical for the prospect of a bullish recovery effort. Follow @PeterHanksFX on Twitter for technical updates on each of the major indices.
Nasdaq Price Outlook
The more-volatile Nasdaq 100 suffered the largest loss in Thursday trading, off more than -2% from Wednesday’s close. It is no surprise then that the tech-heavy Nasdaq is also trading near May’s lows after breaking beneath two Fib levels at 7,290 and probing 7,281 – the swing low from May 13. Should 7,281 be taken out, the Nasdaq will look to March’s lows at 7,253 to pause a continued run lower.
Nasdaq Price Chart: 1 – Hour Time Frame (April 17 – May 23) (Chart 3)
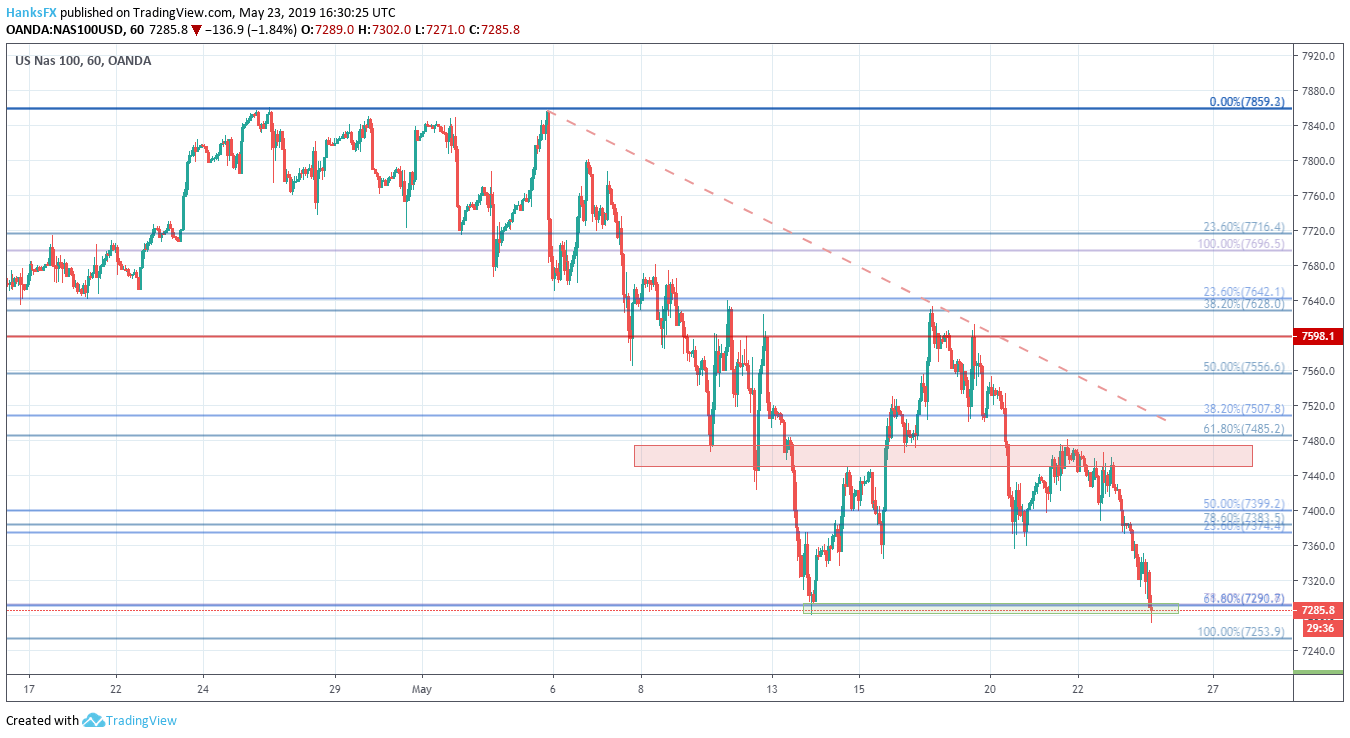
In the event a recovery effort is mounted, the Nasdaq will have to break through the lows from May 15 and 20 – around 7,360. After that, bears would look to offer selling pressure from the two Fib levels at 7,374 and 7,383.
Amid considerable selling pressure, retail traders are confident that US stocks will continue to fall - adding to their short positions. This confidence is observable with IG Client Sentiment data. For a primer on retail sentiment as an indicator, and why this may mean stocks will rise, sign up for a walkthrough webinar.
--Written by Peter Hanks, Junior Analyst for DailyFX.com
Contact and follow Peter on Twitter @PeterHanksFX
Read more: Will the Stock Market Crash in 2019?
DailyFX forecasts on a variety of currencies such as the US Dollar or the Euro are available from the DailyFX Trading Guides page. If you’re looking to improve your trading approach, check out Traits of Successful Traders. And if you’re looking for an introductory primer to the Forex market, check out our New to FX Guide.


