


S&P 500 Outlook Talking Points:
- Last week, retailers warned of higher prices due to steeper tariffs amid the US-China trade war
- This week, a slew of sector components echoed similar fears
- Retail traders are overwhelmingly short the S&P 500, find out how to use IG Client Sentiment Data with one of our Live Sentiment Data Walkthroughs
S&P 500 Outlook: Retail Sector Slides Amid a Series of Missed Earnings
Tuesday trading saw the S&P 500 close comfortably higher after the United States Commerce Department offered a licensing extension to Huawei. Elsewhere, a mixed bag of earnings from Home Depot, JC Penny, Kohl’s and Nordstrom offered their own influence on the Index. While share performances from the companies were mixed, weakness was widespread and a familiar theme rang true throughout.
Home Depot
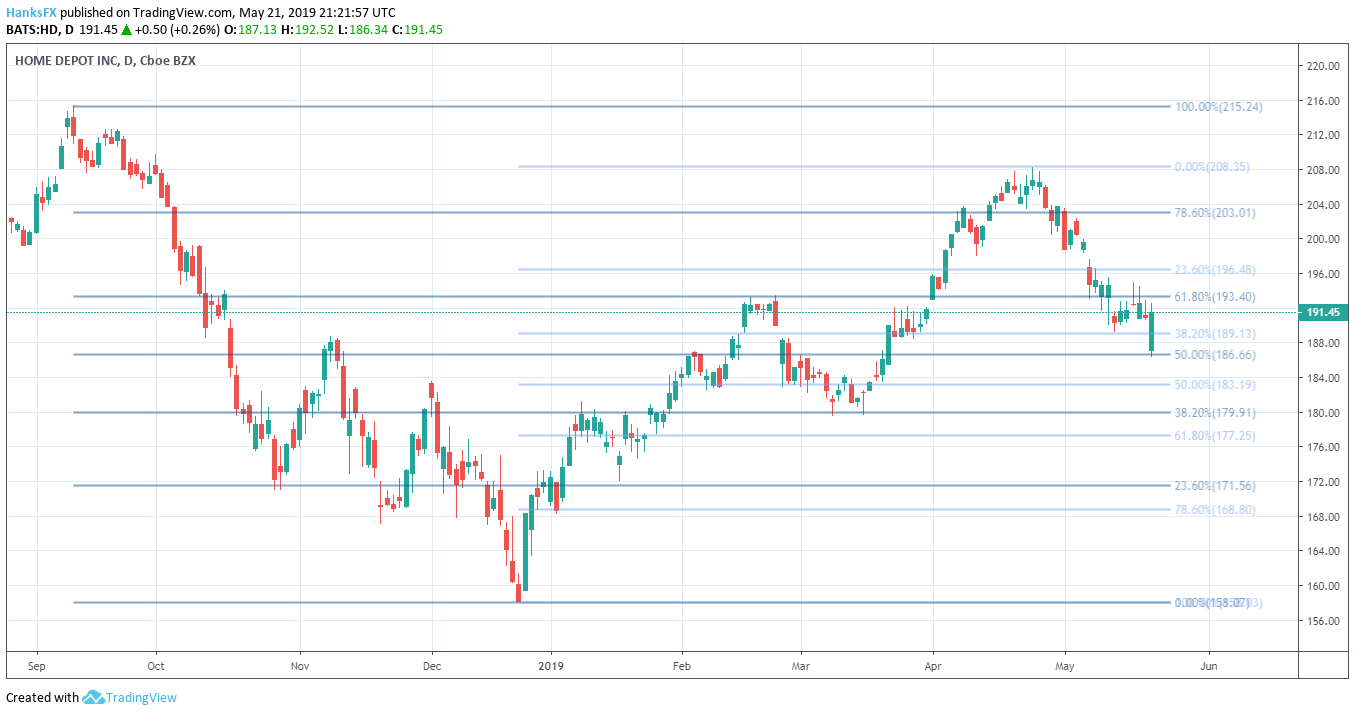
Shares of Home Depot (HD) traded higher in Tuesday’s session – despite a tough quarter by many metrics. The company blamed poor weather conditions, labor shortages and weak lumber prices for their in-store sales miss which increased just 2.5% compared to analyst expectations of 4.2%. Alongside weather, labor and lumber, the company warned of the potential impact from the US-China trade war.
View A Brief History of Trade Wars for background on economic conflicts like the US-China Trade War.
Edward Decker, executive vice president of merchandising for Home Depot sad the latest round of tariffs on Chinese goods would raise the annual cost of goods sold by about $1 billion. “We haven’t worked through what we will do if the cost increase comes to us. Sometimes when we have cost increases, we pass it through in retail prices, sometimes we don’t” he said on a conference call. Home Depot said it already saw a $1 billion impact from US tariffs in 2018. Despite the possible $2 billion hurdle, Mr. Decker said the total was manageable.
Home Depot (HD) Price Chart: Daily Time Frame (September 2018 – May 2019 ) (Chart 1)
JC Penny
JC Penny (JCP) traded near its all-time low of $0.94 a share on Tuesday after warning of a “meaningful impact” on its private and national brands from the next round of tariffs on China. JCP CEO Jill Soltau said the tariffs that were already in effect have had a minimal impact on business, but the company would continue to work on “de-risking efforts” with suppliers.
JC Penny (JCP) Price Chart: Daily Time Frame (September 2017 - May 2019) (Chart 2)

Kohl’s
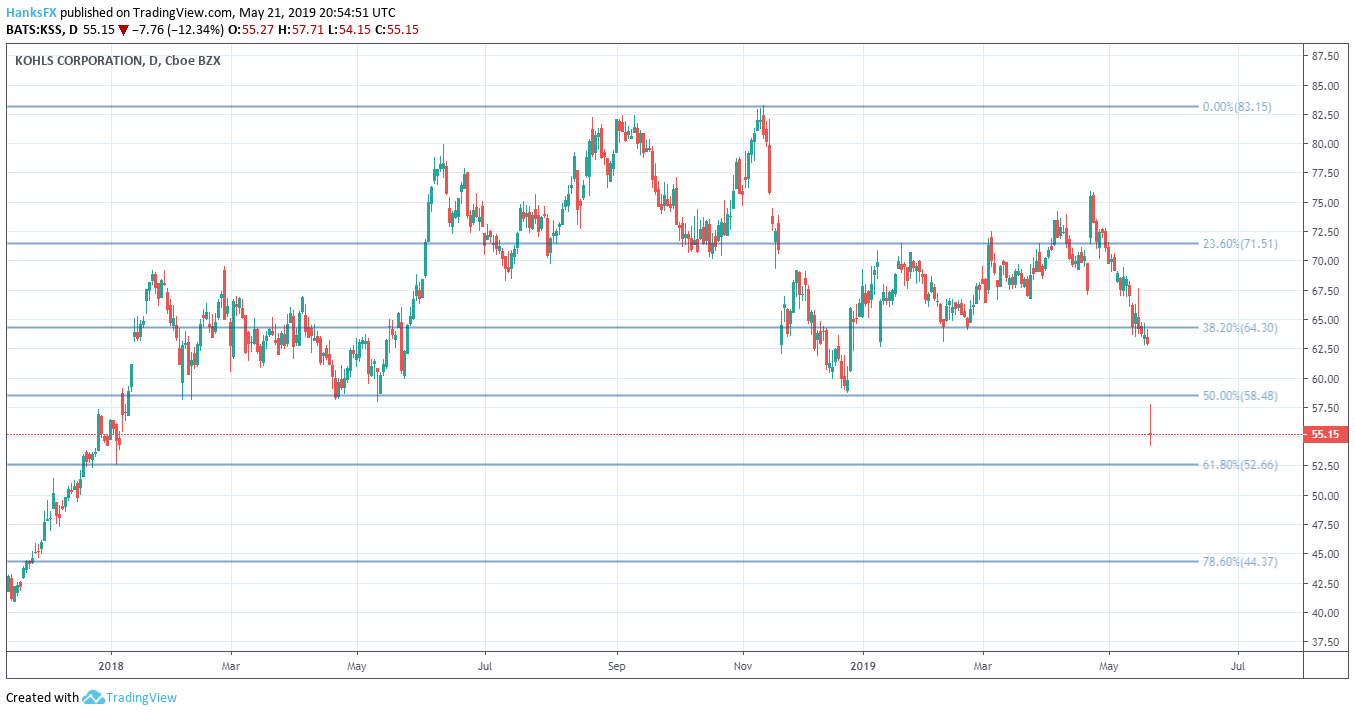
Kohl’s (KSS) suffered a similar fate in Tuesday trading but offered no commentary on the US-China trade war. Same-store sales fell -3.4%, compared to analyst expectations of just -0.2%. In turn, the retailer slashed guidance. On the back of this news, KSS shares slid to their lowest since January 2018 and suffered their largest lower gap since January 27 at -12.15%.
Kohl’s (KSS) Price Chart: Daily Time Frame (December 2017 – May 2019) (Chart 3)
Nordstrom
Finally, Nordstrom (JWN) weighed in with its own disappointing results. Consequently, the company cut guidance and JWN shares traded to their lowest since September 2010 in response. The company did not, however, blame or comment on the US-China trade war. Instead, JWN executives pointed to “softer trends and executional issues” for the quarterly underperformance.
Nordstrom (JWN) Price Chart: Weekly Time Frame (January 2009 – May 2019) (Chart 4)

Retail Sector Falters on Widespread Weakness
Following the sector-wide miss, the XRT retail-tracking ETF traded at its lowest ratio to the S&P 500 since June 2009. While each company offered silver linings in their respective reports, the industry has been slow to adapt to Amazon’s disruption and the US-China trade war is yet another headwind for an already struggling space.
XRT ETF Price Chart: Weekly Time Frame (January 2008 – May 2019) (Chart 5)

Ratio of XRT ETF to SPX overlaid in red
For the S&P 500, retail weakness was overshadowed by tech and semiconductor strength amid the Huawei licensing extension. Now the Index must negotiate Wednesday’s release of Fed minutes from the FOMC meeting earlier this month. From a technical perspective, the Index rests narrowly beneath the 38.2% Fibonacci retracement from March’s lows to May’s high. Ahead of the Fed minutes, follow @PeterHanksFX on Twitter for equity insight.
S&P 500 Price Chart: 1 – Hour Time Frame (May 2019) (Chart 6)

--Written by Peter Hanks, Junior Analyst for DailyFX.com
Contact and follow Peter on Twitter @PeterHanksFX
Read more: TSLA, Uber Stock Troubles Could Signal Shifting Tech Sentiment
DailyFX forecasts on a variety of currencies such as the US Dollar or the Euro are available from the DailyFX Trading Guides page. If you’re looking to improve your trading approach, check out Traits of Successful Traders. And if you’re looking for an introductory primer to the Forex market, check out our New to FX Guide.


