Crude Oil Price Chart and Analysis:
- Middle East tensions ratchet higher.
- US puts EU, Japanese car tariffs on hold for 6 months.
The Brand New DailyFX Q2 2019 Trading Forecast and Guides are Available to Download Now!!
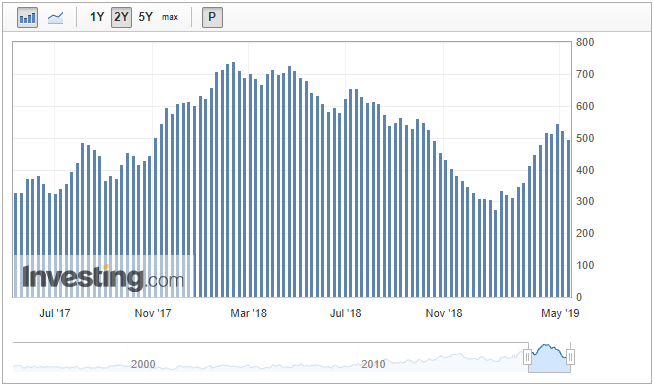
CFTC Crude Oil Speculative Net Positions

How to Trade Oil: Crude Oil Trading Strategies & Tips.
Increased tension between the US and Iran in the Middle East continues to underpin the price of oil as fears grow of supply disruptions and outages. On Wednesday the US issued a travel warning and ordered all non-emergency diplomatic staff to leave Iraq after four ships were attacked of the UAE cost earlier in the week. In addition, a drone attack on a Saudi pipeline was claimed by Houthi rebels, stoking fears further.
Also Wednesday, the US said that it would be delaying its proposed auto tariffs on EU and Japanese cars for six months, sparking a brief risk-on rally. Trade wars continue to dominate global markets and while the US and China remain at loggerheads, any cessation or suspension of trade tariffs elsewhere will be welcomed by markets and investors.
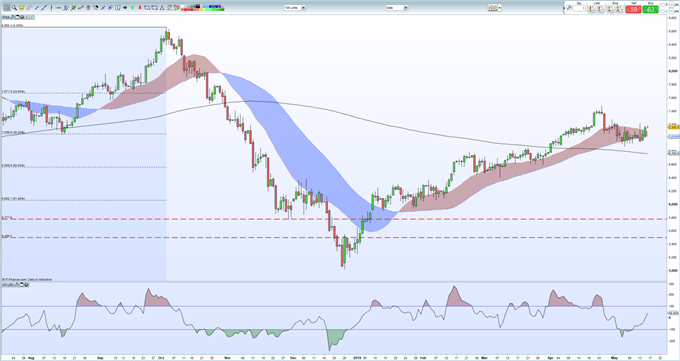
The crude oil price chart remains positive in the short-term with short-term resistance at $72.16/bbl. and $72.80/bbl. attainable targets. A close above these levels would leave the April 24 high at $74.84/bbl. the next target and would take prices back to highs seen over seven months ago. Support is provided by the 38.2% Fibonacci retracement level at $70.56/bbl. before $68.65 and the 200-day moving average at $67.65/bbl. come into play.
Crude Oil Daily Price Chart (July 2018 – May 16, 2019)

Traders may be interested in two of our trading guides – Traits of Successful Traders and Top Trading Lessons – while technical analysts are likely to be interested in our latest Elliott Wave Guide.
What is your view on crude oil – bullish or bearish?? You can let us know via the form at the end of this piece or you can contact the author at nicholas.cawley@ig.com or via Twitter @nickcawley1.


