


3 Major Global Themes:
- The ongoing US-China trade war has exacerbated issues in various trading vehicles while highlighting the benefits in others
- Similarly, a strained US-Iran relationship could look to bolster defense stocks, but broader equity complications could muddy a trade
- Comments from Federal Reserve officials have called the possibility of a rate cut into question even as stocks plummet
3 Major Global Themes and How Best to Trade Them
In the constant search for volatility and market inefficiencies prime for correction, traders must dissect multiple complicated global macroeconomic and geopolitical themes to find the perfect trade. Even after the theme is dissolved to its core, the asset of choice could derail the trade if chosen incorrectly. With that in mind, here are 3 of the top themes on trader’s radar and the best way to trade them.
US-China Trade War
Despite a strong equity rebound in Tuesday trading, it is unlikely markets have seen the last of volatility derived from the US-China trade war. Alongside the broader S&P 500 and Shanghai Composite, equity traders can gain exposure to publicly traded companies through the FXI ETF which offers exposure to the 50 largest and most liquid Chinese stocks on the Hong Kong Stock Exchange. The fund recorded its highest daily trading volume since October 11 as traders exchanged 69 million shares.
FXI ETF Price Chart: Daily Time Frame (November 2017 – May 2019) (Chart 1)

Correlation with Shanghai Composite in blue
Despite the considerable trading volume, the fund shares a statistically significant correlation with the Shanghai Composite – which is not surprising given that the ETF seeks to reflect Chinese stock returns – but some traders question the degree to which the Composite is managed. Like USDCNH and USDHKD, capital intervention is a potential externality and could disrupt the risk-reward profile of a trade.
USDCNH: Why 7.00 is the Spot to Watch in the US-China Trade War
AUDUSD Price Chart: Daily Time Frame (January 2018 – May 2019) (Chart 2)
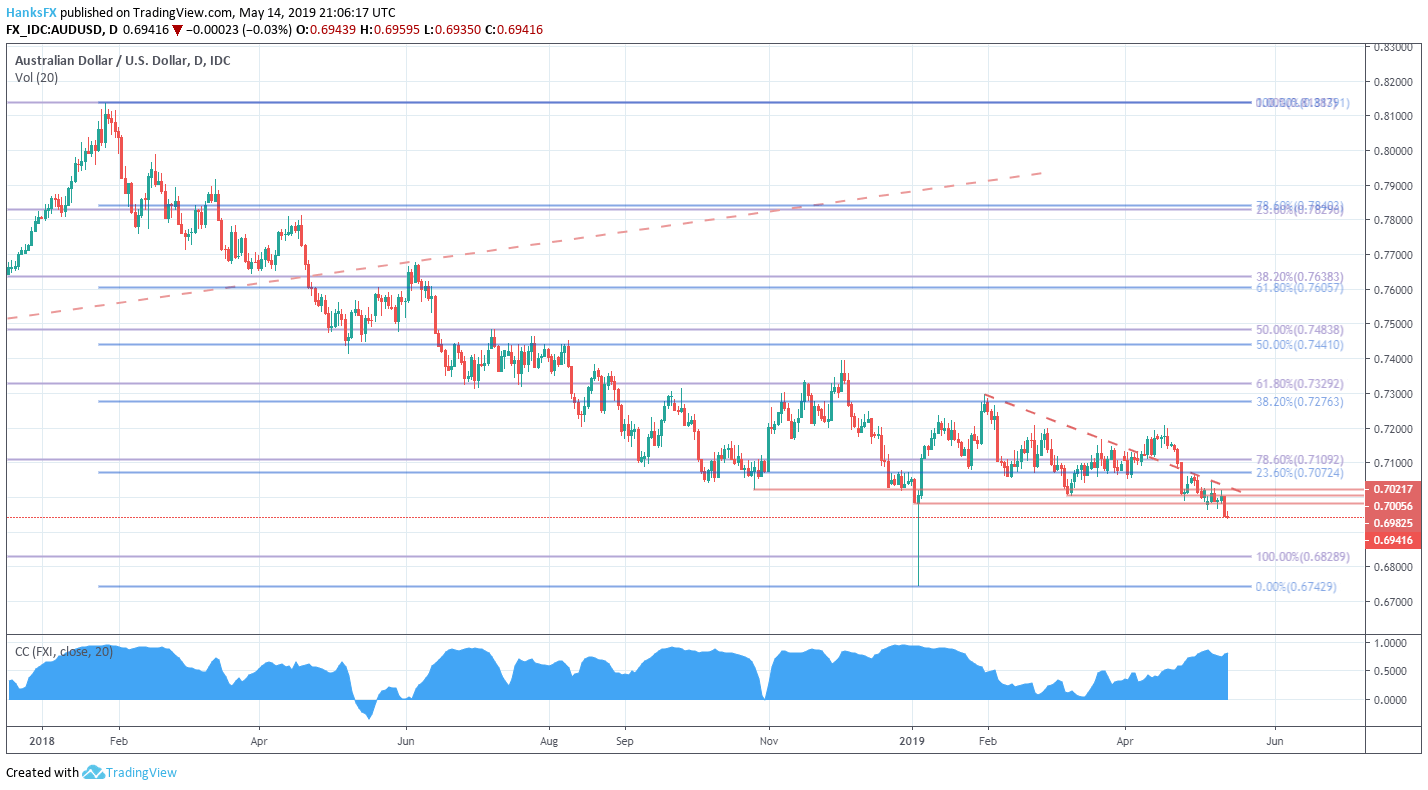
Correlation with FXI ETF in blue
On the other hand, AUDUSD is a major currency pair that is exponentially more liquid and is largely free from central bank management. Like the Shanghai Composite, AUDUSD often shares a strong correlation with XFI – allowing traders to access a key macroeconomic theme without undue risk from government intervention.
US-Iran Relations and Crude Concerns
Another top theme in the week ahead is the deteriorating relationship between the United States and Iran. Tensions have flared between the two nations after the United States imposed further economic sanctions and traders have looked to exploit the situation by seeking exposure in the crude oil ETF USO while the more pessimistic have explored defense industry stocks like the ITA ETF. Like the US-China trade war, a better investment vehicle for such a global theme is a market with deeper liquidity, crude futures.
Crude Oil Price Chart: 4 – Hour Time Frame (March 2019 – May 2019) (Chart 3)
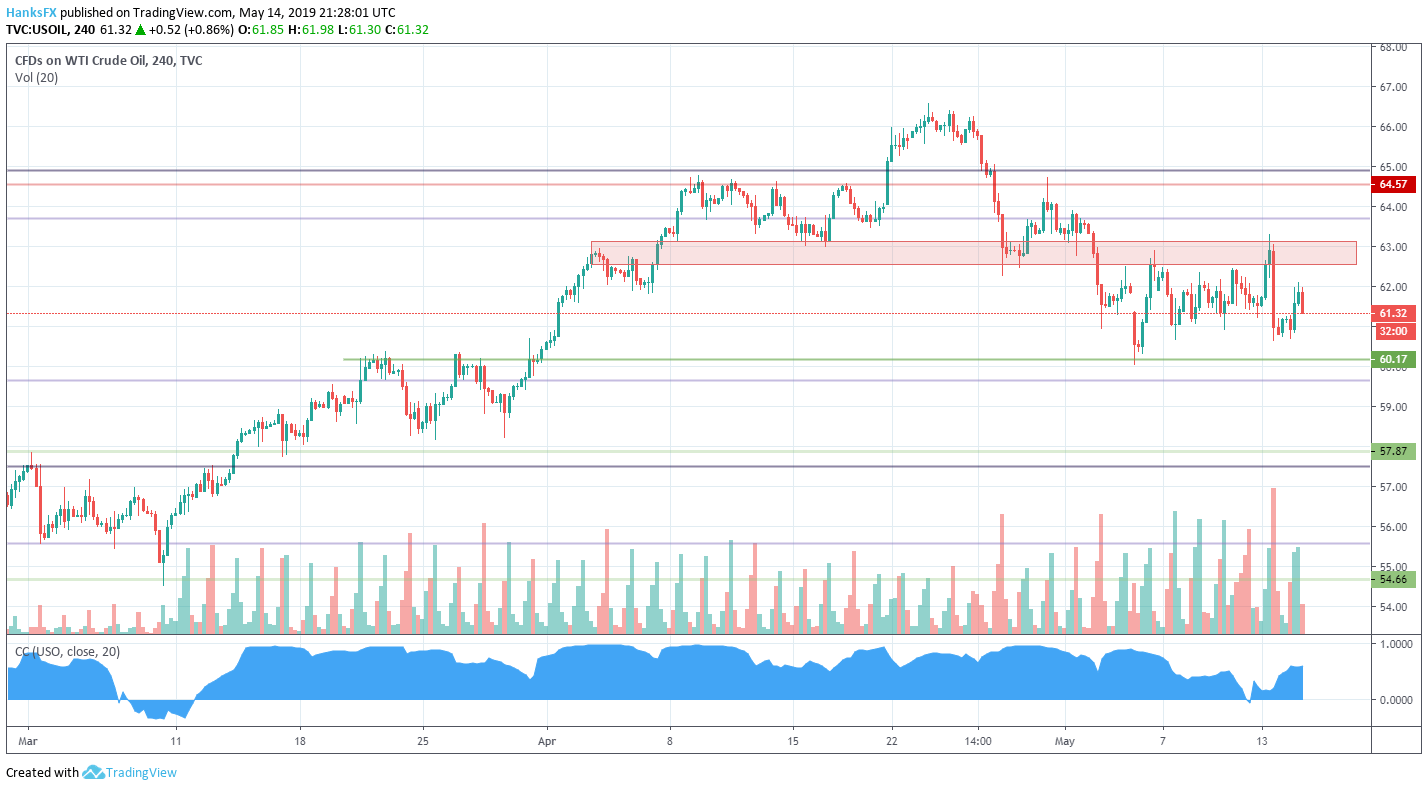
Correlation with USO ETF in blue
Crude oil prices have displayed a sensitivity to Iran developments as stricter sanctions look to crimp the nations exports of the fossil fuel. Traders can gain exposure to this theme via crude CFDs, without risking complications from the equity space. View both a fundamental forecast and a technical viewpoint for crude oil.
The Fed’s Policy Path
A nearly constant theme in the global macroeconomic world of late has been the Federal Reserve’s policy path. All eyes have been searching for the central bank’s leaning and whether the recent equity turmoil will increase the probability of a rate cut. That said, many traders will look to explore this theme via the S&P 500 or Dow Jones, but more sensitive instruments exist, namely the US Dollar.
S&P 500 Price Chart: Daily Time Frame (February 2019 – May 2019) (Chart 4)
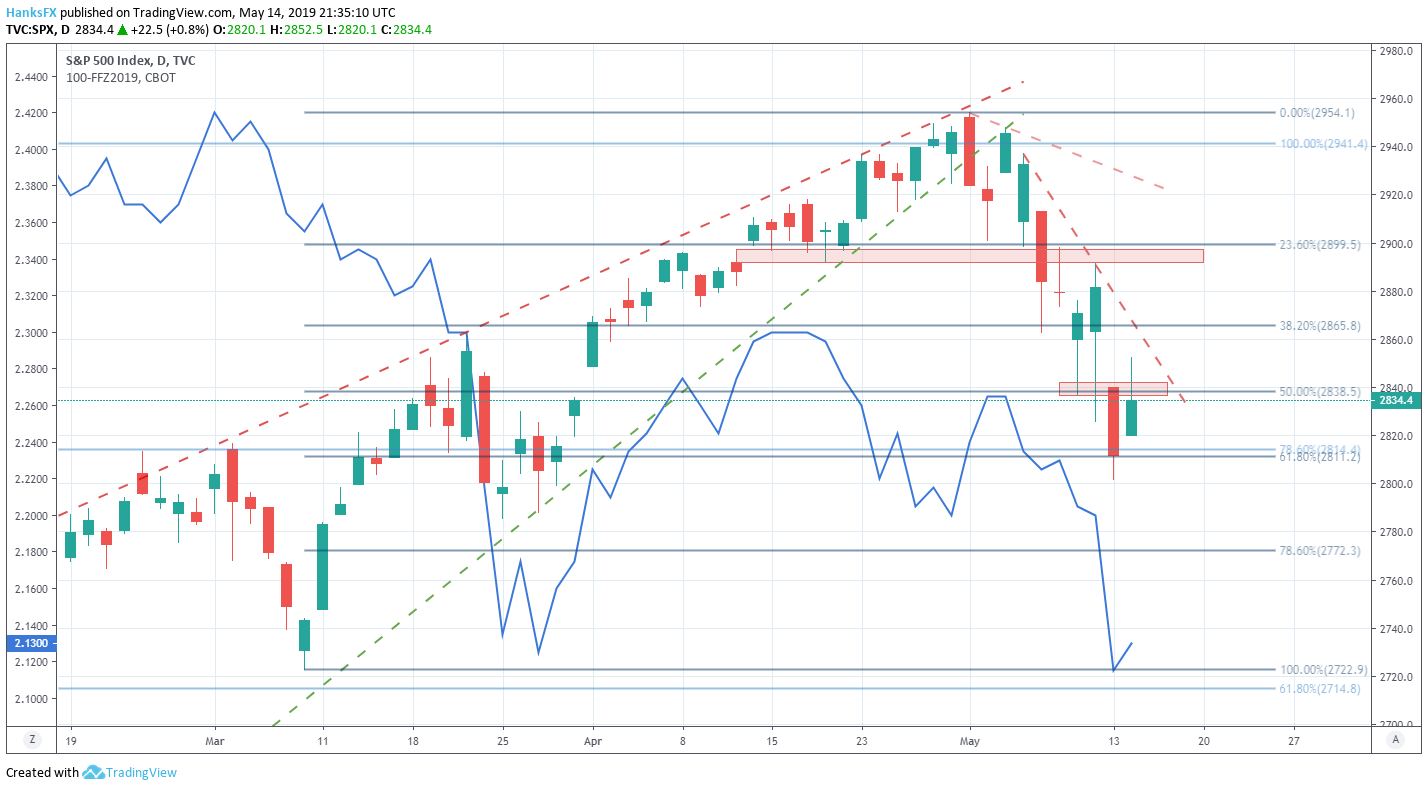
Effective Fed Funds rate at December 2019 meeting overlaid in blue
Amid the recent bout of equity weakness, the odds of a rate cut have mounted with the effective Fed Funds future rate already pricing in a hike by the end of 2019. While the S&P 500 and equity markets will follow this theme closely, the US Dollar – particularly USDJPY – may show greater sensitivity to changes in the Fed’s outlook. Therefore, USDJPY may be a more appropriate investment to gain exposure to the theme.
--Written by Peter Hanks, Junior Analyst for DailyFX.com
Contact and follow Peter on Twitter @PeterHanksFX
Read more: S&P 500 Outlook: ETF Flows Suggest Flight to Currency Market
DailyFX forecasts on a variety of currencies such as the US Dollar or the Euro are available from the DailyFX Trading Guides page. If you’re looking to improve your trading approach, check out Traits of Successful Traders. And if you’re looking for an introductory primer to the Forex market, check out our New to FX Guide.


