


Dow Jones Price Outlook Talking Points:
- As stocks slide on trade war worries, a strong quarterly performance from Disney (DIS) could offer a glimmer of hope
- Disney’s one-day implied volatility is relatively muted considering the broader equity turbulence and event risk
- With trade talks on the fritz and the month of May progressing, will the stock market crash and fulfill the “sell in May and go away” phenomenon?
Dow Jones Price Outlook: DIS Stock Could Fill Gap on Poor Earnings
As earnings season draws to a close, Disney’s financial findings could deliver a needed spark to reignite equity optimism, or at least slow the bleeding, when the company reports after Wednesday’s close. Trade war concerns have weighed on the Dow Jones and other equity markets as the likelihood of higher tariffs increase as the week progresses. Thus, a strong report from the Index’s hottest stock over the last month would be a meaningful first step for the Index to gather its footing.

Surprisingly, option traders have priced in relatively low volatility for DIS after earnings. Although VIX has spiked to its highest levels since January 23, the added risk of earnings seems to have had little impact on the implied volatility of the stock. That said, 20-day implied volatility is considerably higher at nearly 44% which would result in a possible trading range of $75.18 to $192.94.
Contributing to the extreme 20-day implied volatility, DIS rallied 17.65% in the month prior – good for the largest gain in the Industrial Average over that timeframe. Most of the strength followed the announcement of their streaming service in early April as Disney shares gapped nearly 10% higher. With lofty expectations, bruised sentiment and a beleaguered index, it would seem risks are heavily skewed to the downside for Disney – with a large gap looming beneath.
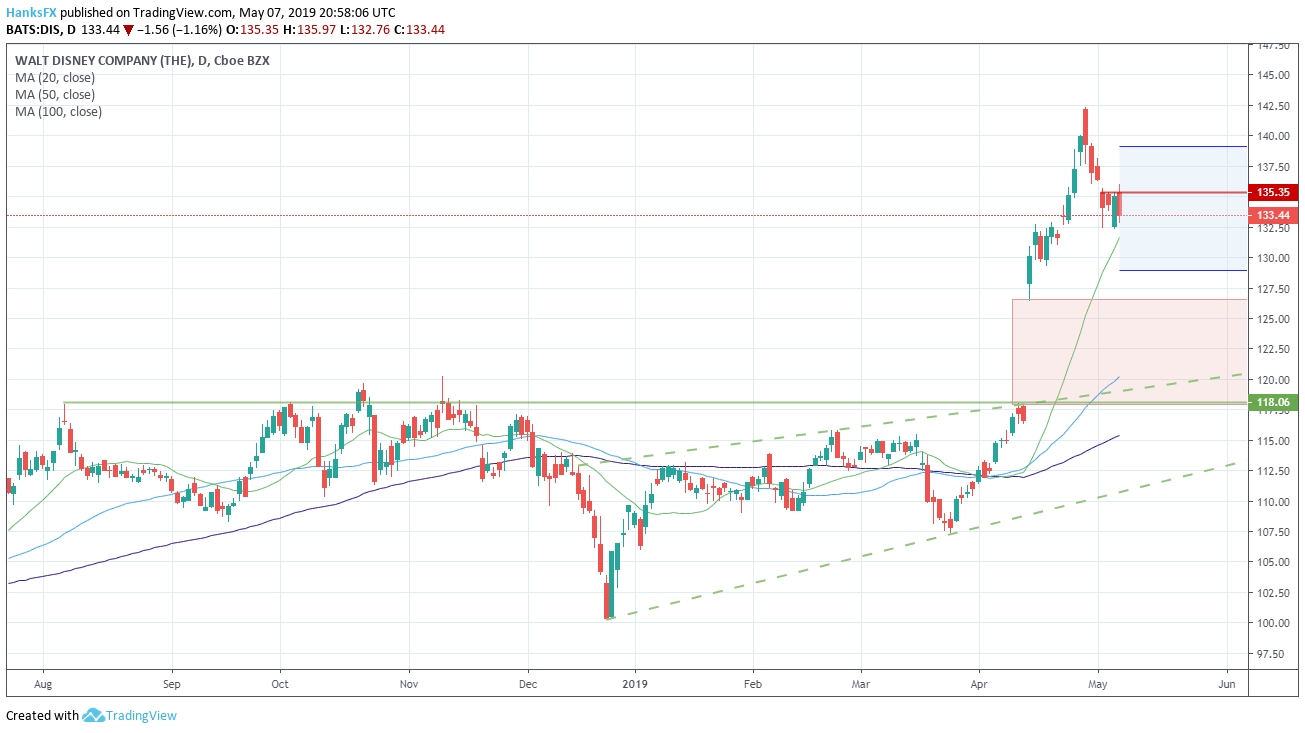
Disney (DIS) Stock Price Chart: Daily Time Frame (August 2018 – May 2019) (Chart 1)
Learn about the conditions necessary to form a gap
With an earnings-related implied trading range from $128.99 to $139.13, option pricing suggests the unfilled gap – from $126.56 to $118.06 – falls outside the expected price action. That said, volatility in the broader market could exacerbate price movement and look to test the gap.
The sizable jump makes immediate support unclear. On a break lower the 20 and 50-day moving averages could offer some buoyancy, but given that the latter exists inside the gap, that could see its efficacy reduced. Similarly, a support trendline around $119 may suffer the same fate – leaving the horizontal support at $118.06 the last line of defense.
To the topside, Disney would face resistance at record highs at $142.27 on an attempted move higher. Like the gap beneath, the stock’s all-time highs also appear outside the implied 1-day trading range, which suggests the stock would first have to break through $135.35 – a level that has rebuked the stock in the last four trading sessions.
Should Disney miss and fill the space down to $118.06, Disney shares could be expected to subtract 107 points from the Industrial Average (calculated using Disney’s Tuesday close price and Dow Divisor per WSJ). In the meantime, trade war developments will continue to influence the Dow Jones as investors weigh the exact implications of a complete breakdown in negotiations. For a follow up on Disney earnings and price action, follow @PeterHanksFX on Twitter.
--Written by Peter Hanks, Junior Analyst for DailyFX.com
Contact and follow Peter on Twitter @PeterHanksFX
Read more: Will the Stock Market Crash in 2019?
DailyFX forecasts on a variety of currencies such as the US Dollar or the Euro are available from the DailyFX Trading Guides page. If you’re looking to improve your trading approach, check out Traits of Successful Traders. And if you’re looking for an introductory primer to the Forex market, check out our New to FX Guide.


