


Nikkei 225, DAX 30, S&P 500 Talking Points:
- The German DAX posted its largest gap lower since February 6, 2018 shedding roughly 240 points
- The S&P 500 followed suit, opening 37 points beneath Friday’s close
- Read about the conditions necessary to produce gaps and the implications they carry
Nikkei 225, DAX 30, S&P 500 Gap Lower on US-China Trade War Breakdown - US Market Open
Through a series of Tweets, President Trump threatened to escalate the US-China trade war – rattling markets as they opened for the week. “Riskier” currency pairs like the Australian and New Zealand Dollars were first to feel the pressure, followed by Asian stocks and oil. The pain then spread to Europe, and has now reached the United States, resulting in early-morning selling for the S&P 500. With equities on shaky ground, some market participants are concerned the trade war breakdown will contribute to the conditions necessary for a stock market crash.
Nikkei 225
Although first on the scene, the Japanese Nikkei suffered relatively little compared to its German and American counterparts. The Index opened just 145 points beneath Friday’s close, good for its largest gap lower since April 10. That said, the index was able to recapture most of the lost territory after bouncing off support around 22,085.
Nikkei 225 Price Chart: Daily Time Frame (October 2018 – May 2019) (Chart 1)
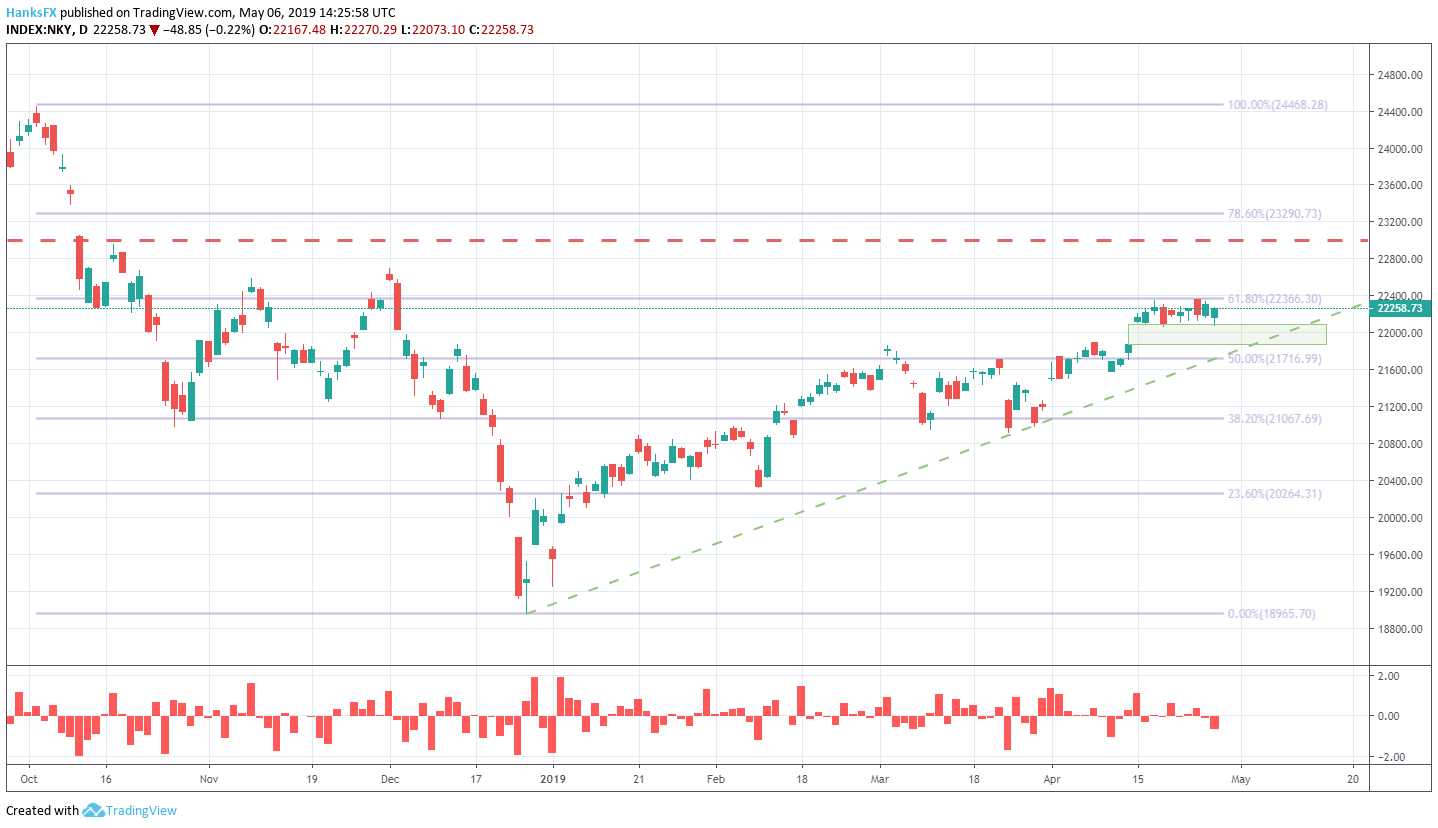
Gap measure percent indicator in red
DAX 30
On the other hand, the German DAX suffered its largest gap lower since February 6, 2018. The 240-point move saw the Index plummet beneath the 61.8% Fibonacci level at 12,334 and subsequent support from the upper bound of the recent channel.
DAX Price Chart: Daily Time Frame (January 2018 – May 2019) (Chart 2)

S&P 500
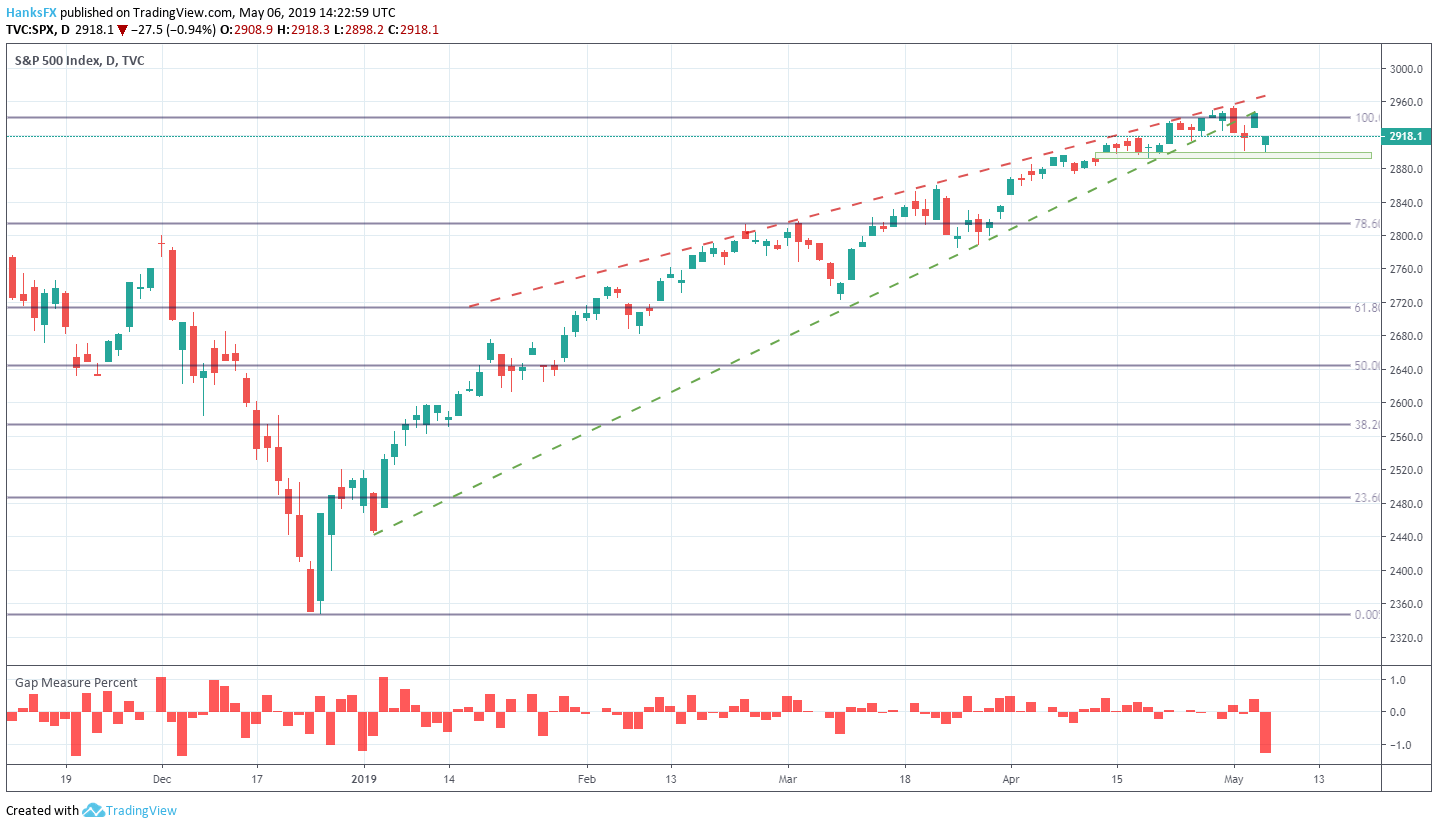
The S&P 500 was the final major equity market to digest the news and opened 37 points lower. The gap is good for the largest in the year-to-date on a points basis but tied with January 2 on a percentage basis. Beyond 2019, the gap is the largest since December 6, 2018. After last week’s FOMC decision saw the Index break out of its ascending channel, it has twice tested the 2,900 level - a break beneath would open the door lower. To the topside, the S&P 500 must once again negotiate record highs and the 100% Fib level at 2,940.
S&P 500 Price Chart: Daily Time Frame (November 2018 – May 2019) (Chart 3)
DailyFX Economic Calendar – North American Events
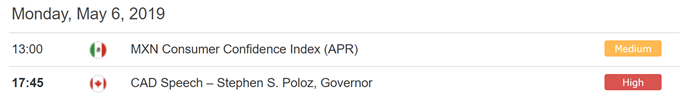
View our economic calendar here
What’s Driving Markets Today
- Dow Jones, S&P 500 Price Outlook: Will Tech Continue the Rally?
- DXY Index Breakout in Question as US-China Trade War Uncertainty Rages
- Gold Price Fills Gap, Stocks Drop as Trump Bemoans Trade Progress
--Written by Peter Hanks, Junior Analyst for DailyFX.com
Contact and follow Peter on Twitter @PeterHanksFX
DailyFX forecasts on a variety of currencies such as the US Dollar or the Euro are available from the DailyFX Trading Guides page. If you’re looking to improve your trading approach, check out Traits of Successful Traders. And if you’re looking for an introductory primer to the Forex market, check out our New to FX Guide.


