


ISM Services Index Talking Points:
- Despite missing estimates, economic activity grew in April for the 111th consecutive month
- Growth continues in the non-manufacturing sector with business activity leading the way
- Despite business activity growth, the new orders, employment and prices indexes all decreased
The US non-manufacturing sector continued to chug along in April, as the Institute for Supply Management indicated this morning through its services PMI a reading of 55.5 percent. Although this morning’s data point missed analyst expectations of 57.0, the reading still signals sector gains seeing that a reading above 50.0 indicates growth. This contrasts to the Markit Services PMI of 52.9 reported earlier last month.
ISM Services Index - April 2019
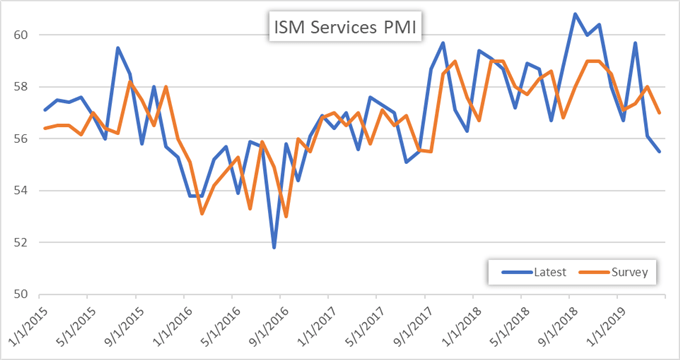
Today’s reading of 55.5 puts the services sector at its 111th month of consecutive growth. Although, there are some concerns behind the numbers, the NMI is a composite index of four underlying indicators of business activity, new orders, employment and supplier deliveries. While the business activity measure increased to 59.5 in April, which is 2.1 percentage points higher than March and the 117th straight month of growth, new orders, employment and the prices index all declined from their March reading.
Even with the index missing expectations and 3 of the 4 components easing from March the industry responsible for more than three-quarters of business output and employment continued to grow. While the headline indicator is data driven, ISM collects comments from business managers as well. Respondents in the survey noted having to increase wages to comply with mandated minimum wage levels, higher construction traffic due to lower mortgage rates, backlogs in supply chains, and a difficulty in finding qualified workers.
The level of response for difficulty in finding qualified workers comes as no surprise as this mornings job numbers from the BLS show that the labor market remains considerably tight. Other notables from the ISM report are rising fuel and labor prices which could steer Fed rate forecasts, along with a short supply of construction subcontractors and labor in general.
--Written by Thomas Westwater, Intern Analyst for DailyFX.com
Contact and follow Thomas on Twitter @FxWestwater
DailyFX forecasts on a variety of currencies such as the US Dollar or the Euro are available from the DailyFX Trading Guides page. If you’re looking to improve your trading approach, check out Traits of Successful Traders. And if you’re looking for an introductory primer to the Forex market, check out our New to FX Guide.


