


GE, GM, AAPL, AMD Talking Points:
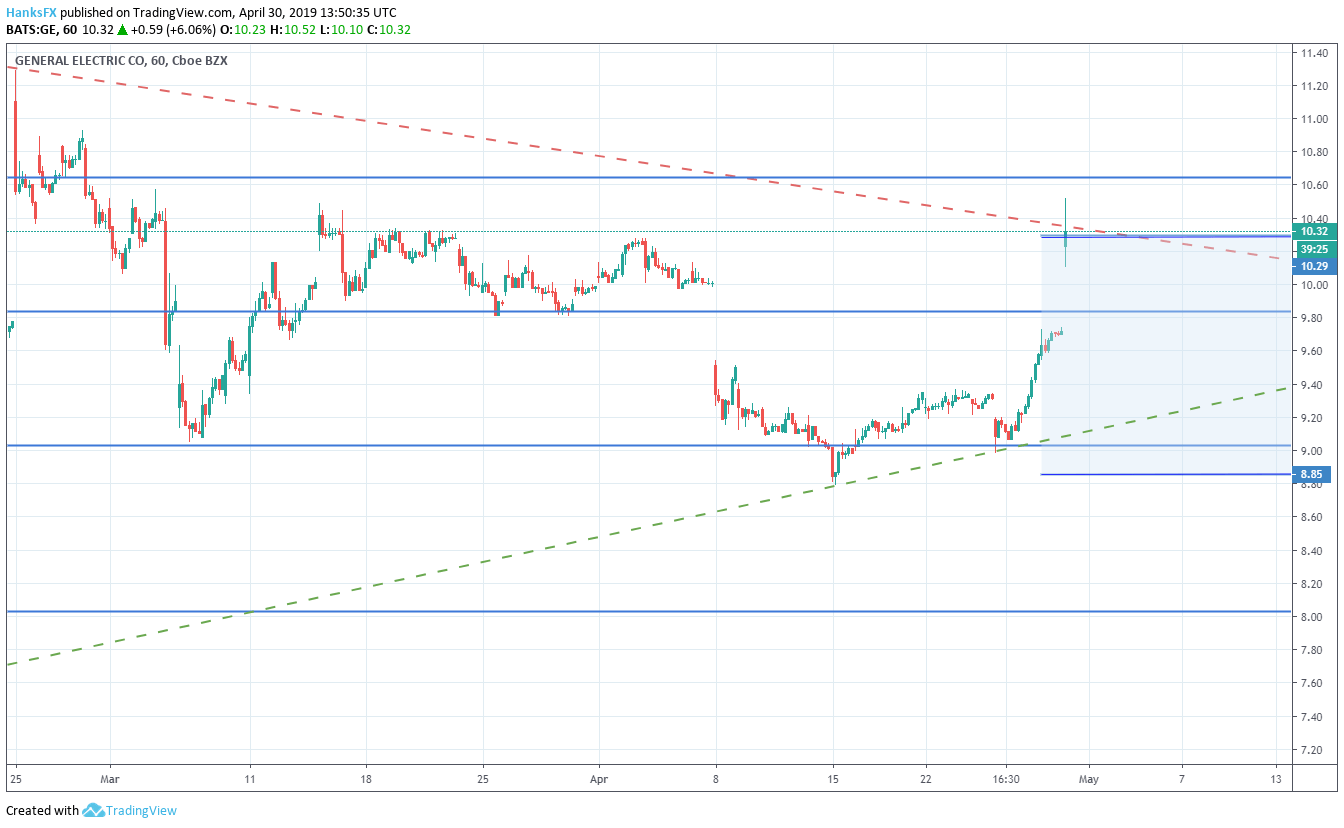
- General Electric (GE) burned less cash than anticipated and gapped higher before subsequently slipping beneath resistance
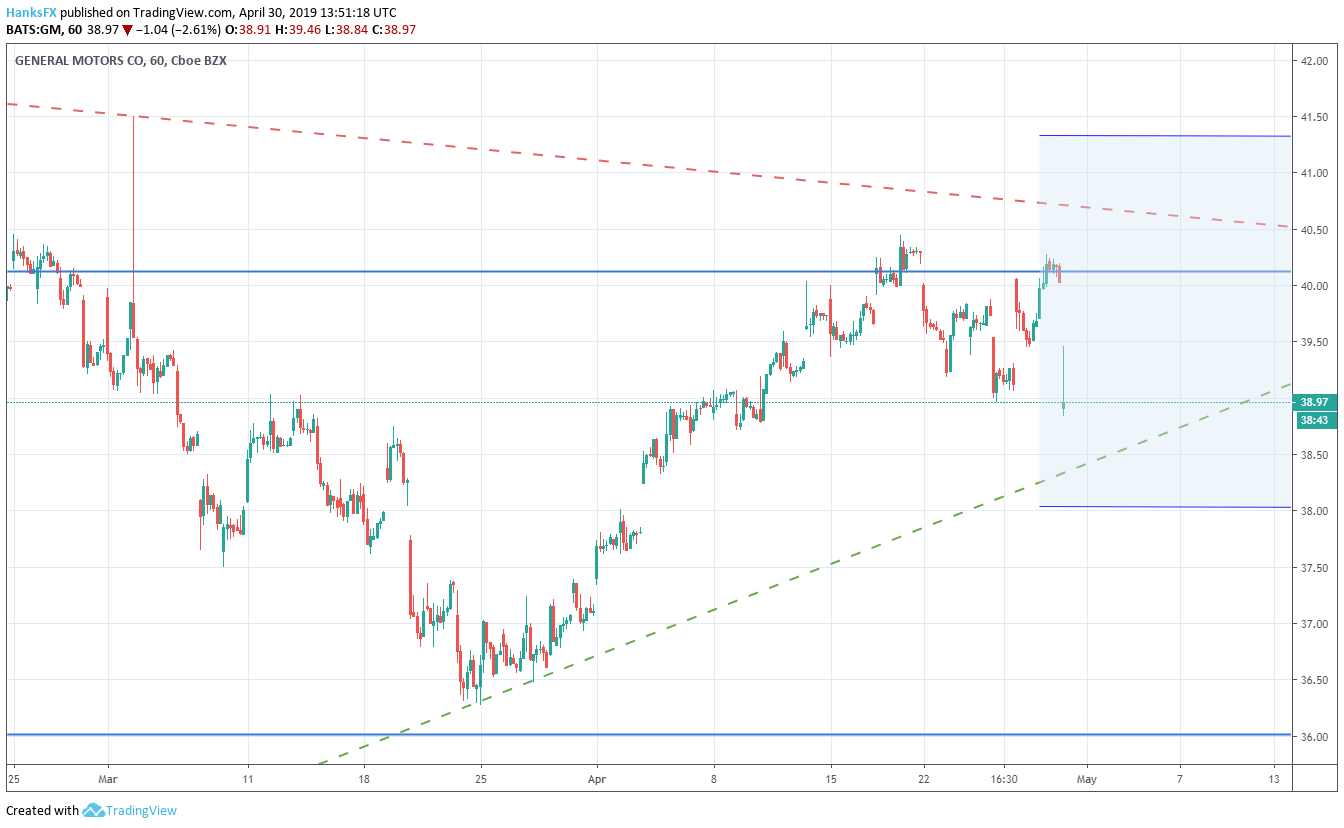
- General Motors (GM) plummeted after the automaker missed on both revenue and vehicle sales
- Apple (AAPL) is due to report after the close in a week where investors are on high alert for flash crashes
Stock Market Update: GE, GM Earnings Recap, AAPL and AMD Ahead
General Electric and General Motors delivered split quarterly results Tuesday morning, with both stocks remaining within their earnings-related implied volatility range. Despite a quarter of negative cash flow, GE burned less cash than expected as the company continues to restructure and trim fat. Shares of the company gapped higher, only to retrace below technical resistance.
General Electric (GE) Stock Price Chart: 1 – Hour Time Frame (February – April) (Chart 1)
On the other hand, General Motors saw both revenue and number of vehicles sold fall beneath expectations. GM shares gapped lower at the open, down roughly 2.6%. The stock may now look for support from December’s rising trendline and a close above last week’s swing low at $38.96 may see the level offer a modicum of support.
General Motors (GM) Stock Price Chart 1 – Hour Time Frame (February – April) (Chart 2)
While both former blue-chips remained in their implied range, tech giant Google fell considerably outside its own range after shares slipped 8% on the back of a bad miss. The FAANG group and corresponding tech sentiment will now look to the release of earnings from Apple (AAPL) and Advanced Micro Devices (AMD).
AAPL, AMD Earnings Implied Volatility

AAPL Earnings Outlook
After a cut to their earnings outlook caused a USDJPY Flash Crash, the market may have heightened sensitivity when it comes to Apple’s quarterly results. Only trailing Microsoft in market cap, Apple has substantial sway over US indices - beyond a sentiment standpoint. That said, the company’s size assists in keeping the implied volatility of its stock price contained. With 1-day implied volatility near 5%, AAPL could swing as high as $211 or as low as $191.
Apple (AAPL) Stock Price Chart: Daily Time Frame (October 2018 – April 2019) (Chart 3)

In the range, the stock will have to negotiate the 61.8% Fibonacci retracement from October’s highs to January’s lows. The level will look to act as support, having rebuked attempted moves lower in the prior two weeks. Beyond that, lows from April 8 and 12 at $196.53 will be another price point to watch. To the topside, only April’s swing-high at $208.48 is within the implied range and will offer the first form of resistance. Secondarily, the 78.6% Fib level at $213.94 may come into play should earnings really impress.
Check out our Second Quarter forecasts for the S&P 500, Dow Jones, Gold and more.
AMD Earnings Outlook
AMD is another hot stock to watch. As a posterchild of the semiconductor boom, AMD is a highflyer and has returned 44% year to date. That said, implied volatility ahead of earnings and in the weeks to follow is heightened. Earnings related volatility is expected above 12%, suggesting an implied price range of $24.20 to $30.88.
AMD Stock Price Chart: Daily Time Frame (November 2018 – April 2019) (Chart 4)
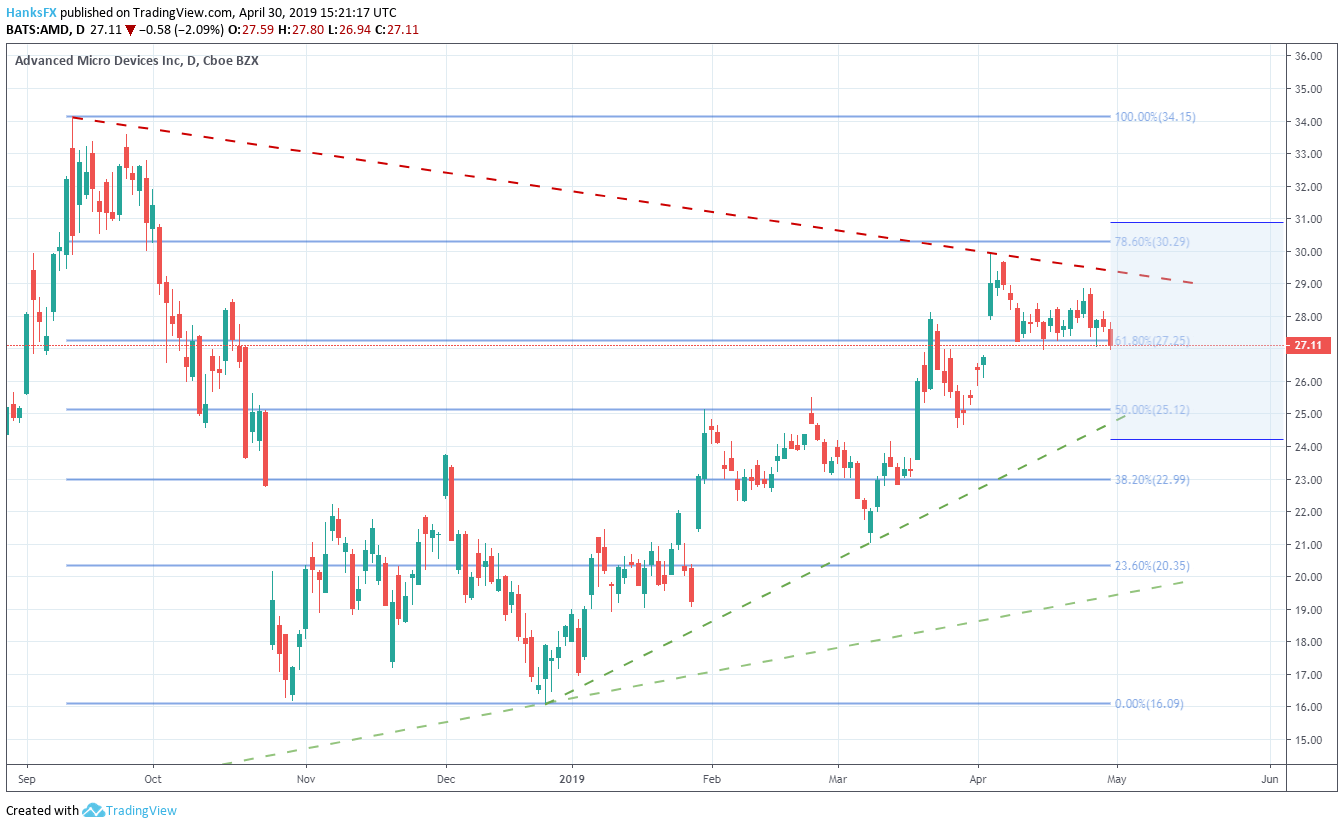
Intraday trading has pressured shares beneath the 61.8% Fib at $27.25. A close below would be a notably bearish development over the longer term, marking the first close under the level since April 2. Although the level has influenced price in the past, it is unlikely to offer much influence immediately after earnings given its current proximity to the trading price. In the days to follow however, $27.25 may once again mark an important technical point.
Check out the Technical Forecast for the S&P 500, Dow Jones, DAX 30, and FTSE 100.
Also inside the implied range, a descending trendline from September will offer resistance to the topside before the 78.6% Fib level at $30.29 comes into play. Conversely, technical support will come into play at $25.12 – the 50% Fib level. A rising trendline from December could also come into play if earnings are especially underwhelming. As traders paradoxically await today’s close, view our Economic Calendar for all upcoming events in the week ahead and follow @PeterHanksFX on Twitter for equity insight.
--Written by Peter Hanks, Junior Analyst for DailyFX.com
Contact and follow Peter on Twitter @PeterHanksFX
Read more: USDCAD’s Failed Breakout Attempt Hinges on Next Crude Oil Price Move
DailyFX forecasts on a variety of currencies such as the US Dollar or the Euro are available from the DailyFX Trading Guides page. If you’re looking to improve your trading approach, check out Traits of Successful Traders. And if you’re looking for an introductory primer to the Forex market, check out our New to FX Guide.


