


Asia Pacific Markets Wrap Talking Points
- Equities mixed in Asia, forex shows risk aversion prevailing
- Samsung Electronics disappointing earnings sinks KOSPI
- S&P 500 showing technical and sentiment signs of a top
Find out what retail traders’ equities buy and sell decisions say about the coming price trend!
Asia Pacific equities traded mixed, failing to see market-wide follow-through on cautious gains stemming from Wall Street. There, the S&P 500 and Dow Jones Industrial Average closed 0.11% and 0.04% higher with some gains following lackluster core PCE data.
Japanese markets are offline for the Golden Week holiday, reducing liquidity and increasing the odds of sudden FX volatility. This was the case with the Australian Dollar when it suddenly dropped on softer-than-expected Chinese manufacturing PMI data.
The anti-risk Japanese Yen meanwhile gained against its major counterparts as the ASX 200 and KOSPI, Australia’s and South Korea’s benchmark stock indexes respectively, both fell about 0.50%. The latter was vulnerable as Samsung Electronics (a key component of the index) offered disappointing earnings.
China’s Shanghai Composite, on the other hand, was more than 0.4% higher at the times of this writing. However, market pessimism might prevail over the remaining 24 hours with S&P 500 futures pointing further to the downside. US consumer confidence, which may follow the trend of lackluster data, could be a catalyst.
S&P 500 Technical Analysis
S&P 500 futures, which offer a view of after-hours trade, are showing signs of topping on the daily chart. This because of a Shooting Star, which shows indecision, formed after prices failed to close above the record highs in September. Accompanying this is a bearish Rising Wedge going back to February.
On top of this, negative RSI divergence indicates fading upside momentum which can at times precede a turn lower. A decline places near-term support around 2900. Meanwhile, sentiment readings do warn that the S&P 500 may be readying up to turn lower.
Want to learn more about how sentiment readings may drive the S&P 500? Tune in each week for live sessions as I cover how sentiment can be used to identify prevailing market trends !
S&P 500 Futures Daily Chart
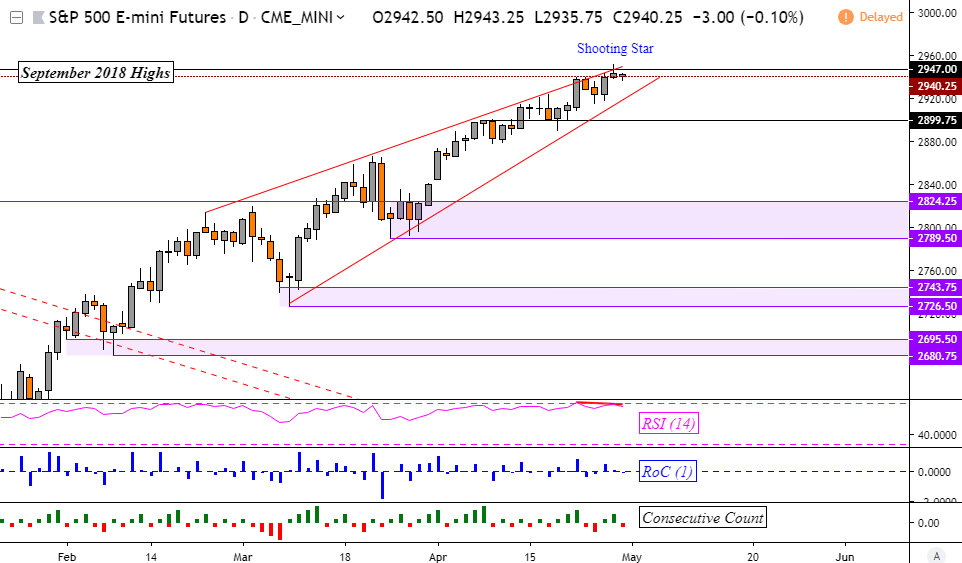
Chart Created in TradingView
FX Trading Resources
- See how equities are viewed by the trading community at the DailyFX Sentiment Page
- Just getting started? See our beginners’ guide for FX traders
- Having trouble with your strategy? Here’s the #1 mistake that traders make
--- Written by Daniel Dubrovsky, Junior Currency Analyst for DailyFX.com
To contact Daniel, use the comments section below or @ddubrovskyFX on Twitter


