


Gold and Silver Price Analysis and Charts.
- Gold chart remains negative but short-term oversold.
- Silver propped up by the long-term moving average.
DailyFX Q2 Forecasts and Top 2019 Trading Opportunities.
Trading the Gold-Silver Ratio: Strategies and Tips.
Gold – Chart Remains Oversold and Negative
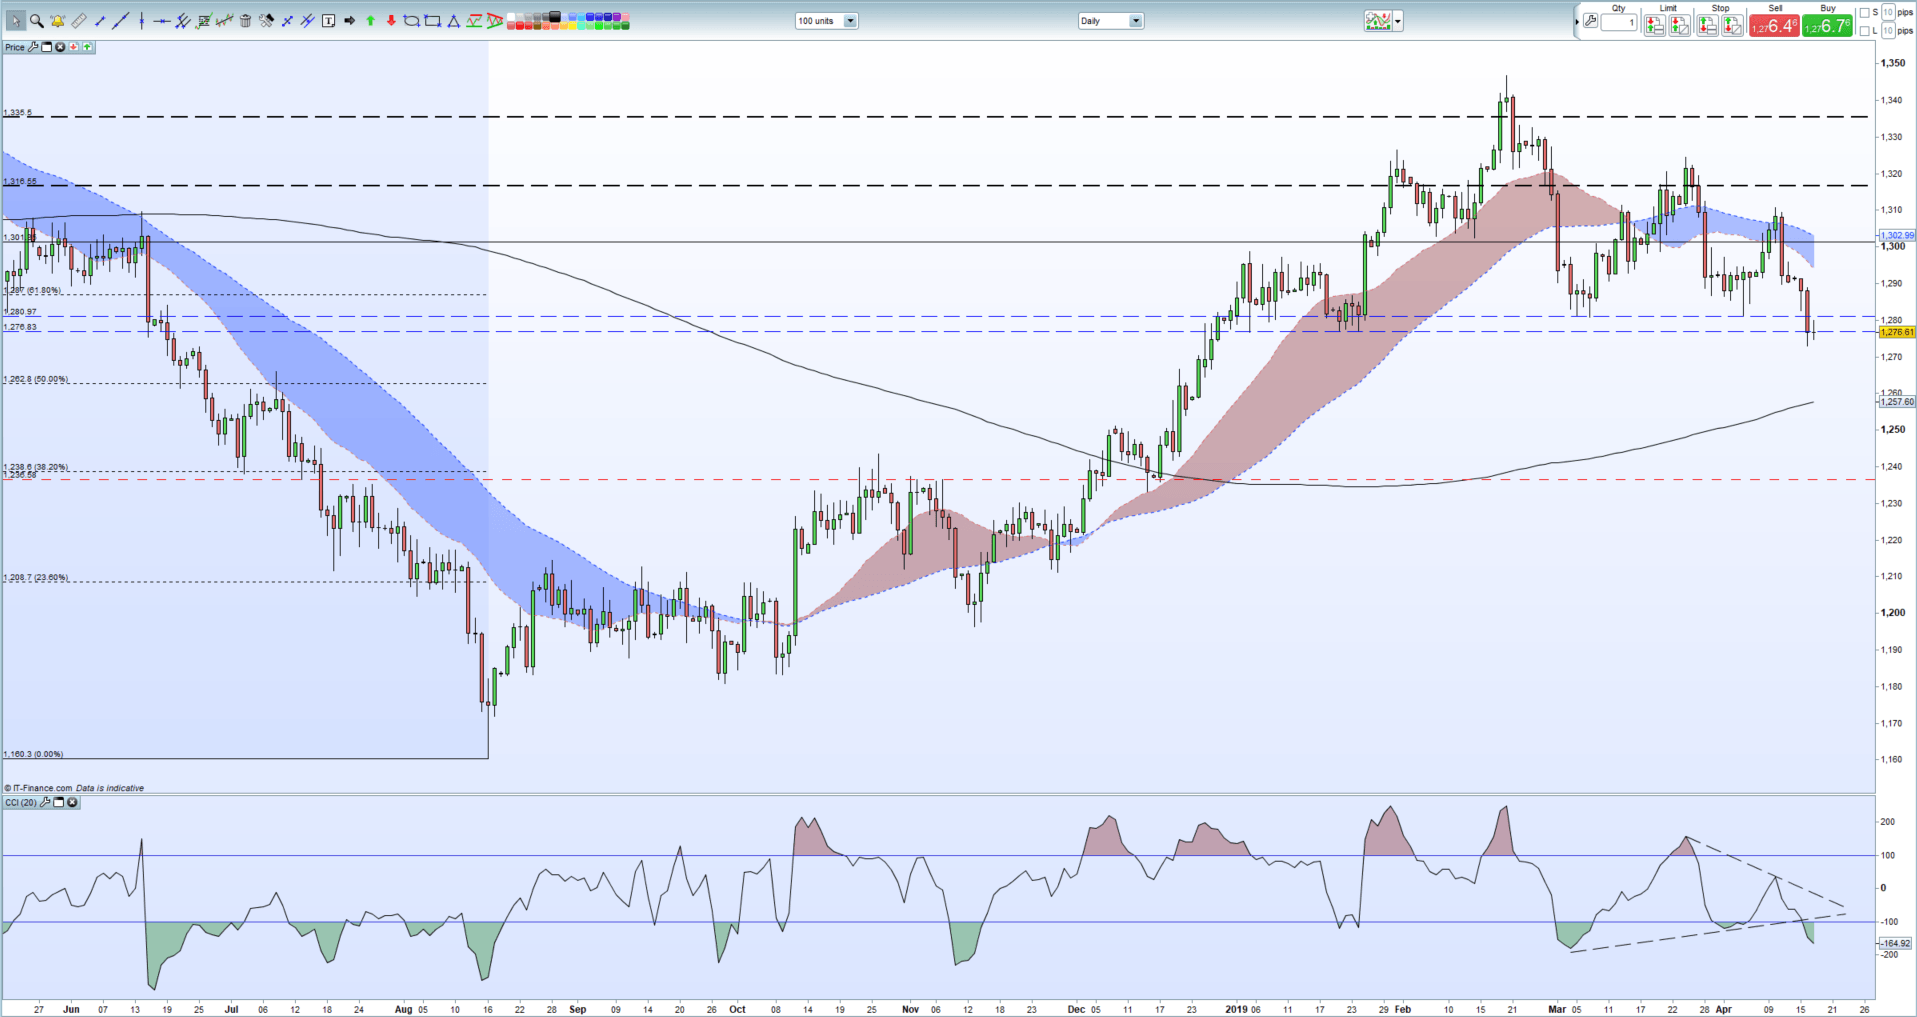
The recent sell-off in gold has turned the medium-term outlook for the precious metal to negative with further losses likely ahead. To the downside, 50% Fibonacci retracement at $1,262.8/oz. guards the 200-day moving average around $,1258/oz. Gold also closed below the $1,276.8/oz. - $1,280.9/oz. zone which will likely change to resistance in the short-term. Gold bulls may find some hope from the CCI indicator at the bottom of the chart which is at its most oversold since mid-November and at an extreme level which may fuel a short-term uptick.
How to Trade Gold: Top Gold Trading Strategies and Tips.
Gold Daily Price Chart (June 2018 – April 18, 2019)
Silver – Chart Respecting the 200-Day Moving Average for Now
Silver remains propped up by the 200-day moving average for now, but any further re-tests of this level may see its price fall further. The long-term ma currently sits around $14.95 just ahead of the 23.6% Fibonacci retracement at $14.92. A close below all three moving-averages would change the chart bias to negative. The CCI indicator has just moved out of oversold conditions. To the upside, there are a cluster of recent highs and the 20- and 50-day moving averages between $15.10 and $15.35.
How to Trade Silver: Top Silver Trading Strategies.
Silver Daily Price Chart (July 2018 – April 18, 2019)

IG Client Sentiment shows how retail traders are positioned in a wide range of currencies, commodities and cryptocurrencies. See how recent changes in positioning affect our trading bias.
--- Written by Nick Cawley, Market Analyst
To contact Nick, email him at nicholas.cawley@ig.com
Follow Nick on Twitter @nickcawley1


