


Gold Price Analysis, News and Chart.
- Technical support under pressure as buyers sit on the sidelines.
- Markets undecided on risk appetite but trade talks turn mildly positive.
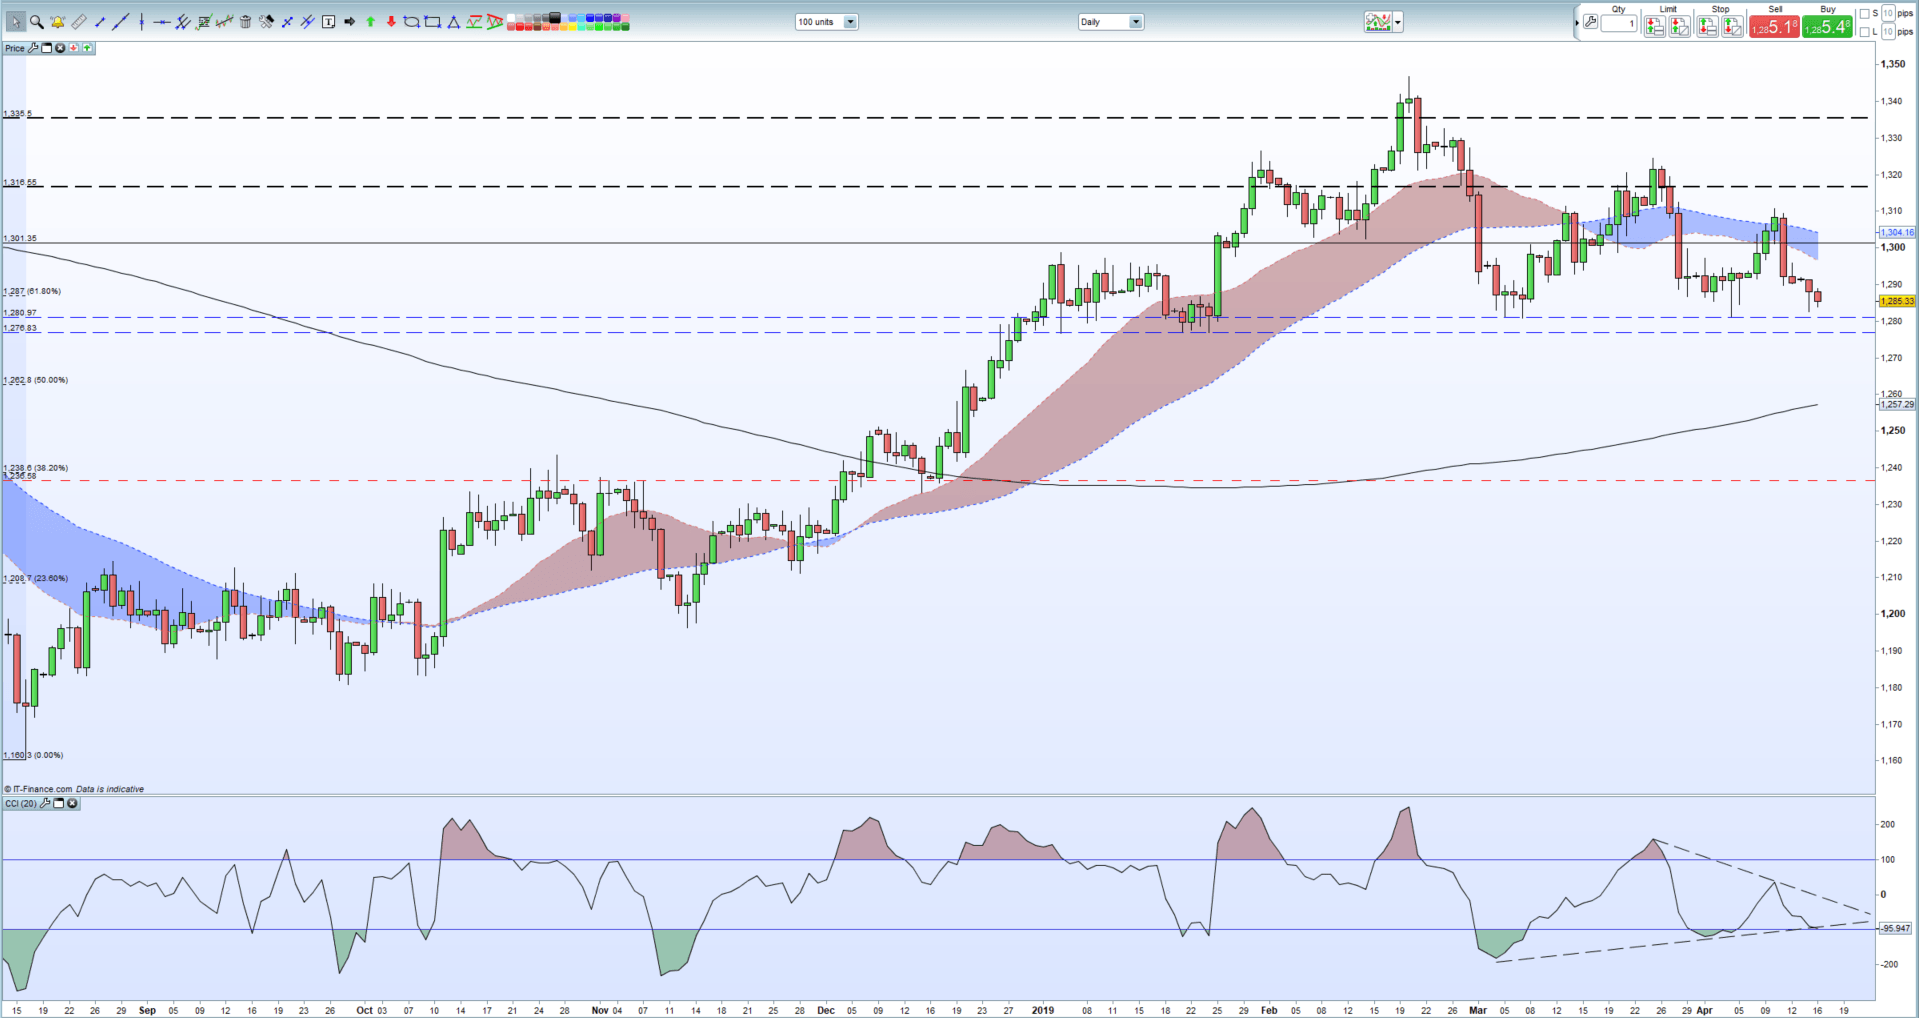
Gold is currently sitting on the important 61.8% Fibonacci retracement level of the April – August 2018 move at $1,287/oz. and may make another attempt at the recent lows. A quiet start to a holiday-shortened week in Europe saw gold fade lower and if gold closes below $1,287/oz. an important zone between $1,281/oz. and $1,276.8/oz. nears. Below here the precious metal will be trading back at levels last seen at the end of December 2018 and the sell-off may gather strength. The chart does show a couple of supportive signs, with gold remaining above the important 200-day moving average, currently at $1,257/oz. while the CCI indicator shows the metal touching oversold conditions.
How to Trade Gold: Top Gold Trading Strategies & Tips.
Gold Price Chart Daily Time Frame (August 2018 – April 8, 2019)
US Treasury yields continue to weigh on gold with the yield on the 10-year UST at, or close to, a one-month high of 2.56%. The yield curve also remains positive with the 3-month/10-year spread at +13 basis points and the 2-year/10-year spread at +16 basis points. US-China trade deal optimism continues to grow after US Treasury Secretary Steven Mnuchin said that talks were progressing well, while US-Japan trade talks are also said to moving in a positive direction.
US Treasury 10-year Yield - April 16, 2019

IG Client Sentiment shows that retail traders are 76.9% net-long of Gold, a bearish contrarian indicator. See how recent changes in positioning affect our trading bias.
--- Written by Nick Cawley, Market Analyst
To contact Nick, email him at nicholas.cawley@ig.com
Follow Nick on Twitter @nickcawley1


