


S&P 500 Outlook Talking Points:
- A key risk asset saw considerable outflows this week that were surpassed only by outflows in February 2018
- While the S&P 500 presses higher, retail traders attempt to call the top
- Fresh quarterly forecasts are out! View Q2 forecasts for the S&P 500, US Dollar, British Pound and more.
S&P 500 Grasps at New Highs as Retail Traders Fear Past Declines
As the S&P 500 looks to retest all-time highs, market participants may be more sensitive to risk this time around. With the S&P 500 approaching levels that preceded prior declines in February and September of 2018, investors are keen to investigate each threat to the bullish trend.
One such threat may be the emerging market bond ETF (EMB). The fund saw its largest outflow since February 5, 2018 and the S&P 500 subsequently slumped about 1%. After the streak of outflows was finished and the fund registered its next net inflow (10 days later) the S&P 500 had sunk 4.4%. During the streak, the fund saw nearly $2.2 billion leave its coffers.
Despite the considerable risk-off mood that swept over markets during this period, the S&P 500 rebounded by roughly 2.8% over the following four weeks. It is important to note that previous outflows for the fund trailed declines in the S&P 500 which reduces the efficacy of the fund as a leading indicator and with that in mind, the cause for concern due to the outflow is seriously mitigated.
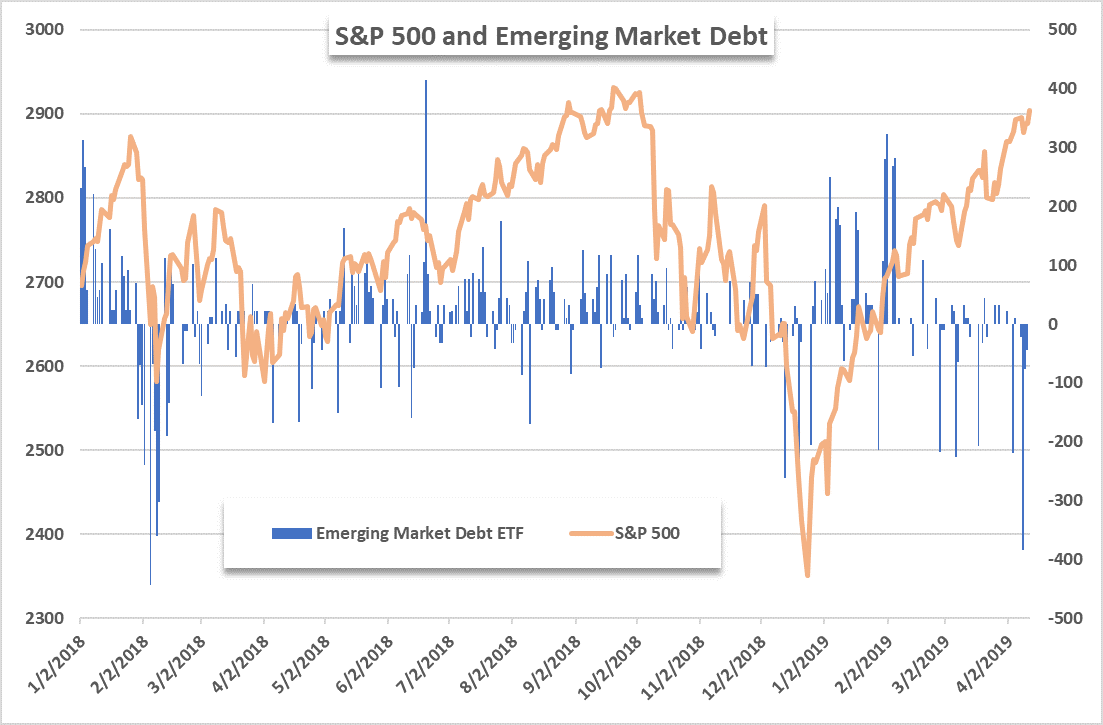
Further, EMB flows were largely unbothered by the index’s decline in September and recorded net inflows through the end of 2018. In fact, Tuesday’s outflow from EMB may be due to a report from the IMF which highlighted emerging market debt as an area of global weakness. While the longer-term implications of emerging market weakness are certainly worrisome, it seems a stretch to pin the outflow as a precursor to another S&P 500 retracement.
View Client Sentiment Data provided by IG to spot hidden trends and signals. To learn more about the tool, sign up for one of our Live Webinar Walkthroughs.
Similarly, mutual fund flows – typically indicative of retail trader funds – have seen roughly $9.70 billion in outflows last week, with the vast majority from equities. The data gathered by the Investment Company Institute bolsters a bullish case – as we typically take a contrarian view to retailer sentiment. This research is compounded by our own findings at IG.
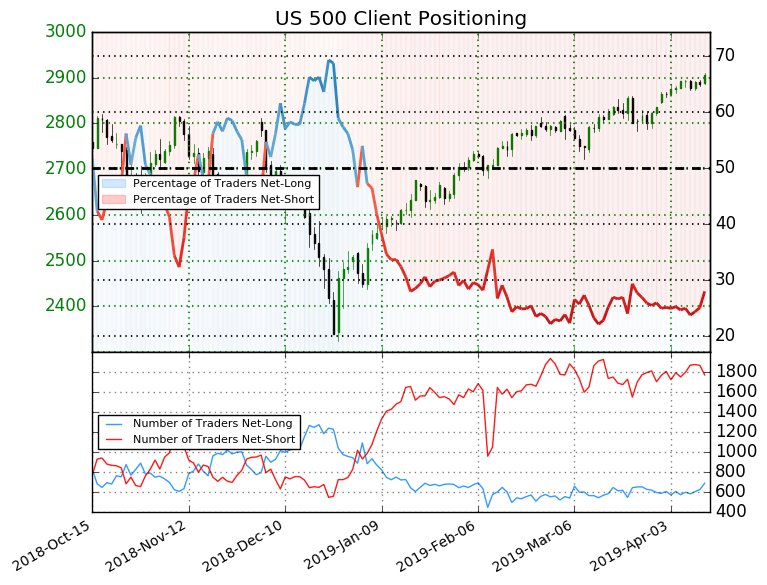
Over the past few weeks, IG retail traders have only increased their short exposure to the S&P 500. During this time, the S&P 500 pressed higher - unbothered by global growth and other concerns. With the advent of earnings season, a string of positive earnings from JP Morgan, Wells Fargo and PNC Bank have set high standards for upcoming reports. Follow @PeterHanksFX on Twitter for equity insight and earnings season updates.
--Written by Peter Hanks, Junior Analyst for DailyFX.com
Contact and follow Peter on Twitter @PeterHanksFX
Read more: S&P 500 Trading Volume: A Black Hole Around Fed Minutes
DailyFX forecasts on a variety of currencies such as the US Dollar or the Euro are available from the DailyFX Trading Guides page. If you’re looking to improve your trading approach, check out Traits of Successful Traders. And if you’re looking for an introductory primer to the Forex market, check out our New to FX Guide.


