


Bitcoin (BTC) Price Analysis, News and Chart:
- Bitcoin (BTC) breakout spurs larger market advance.
- Bitcoin Cash (BCH) ripping higher
DailyFX Bitcoin Landing Page – Prices, Charts, Analysis and Real-Time News
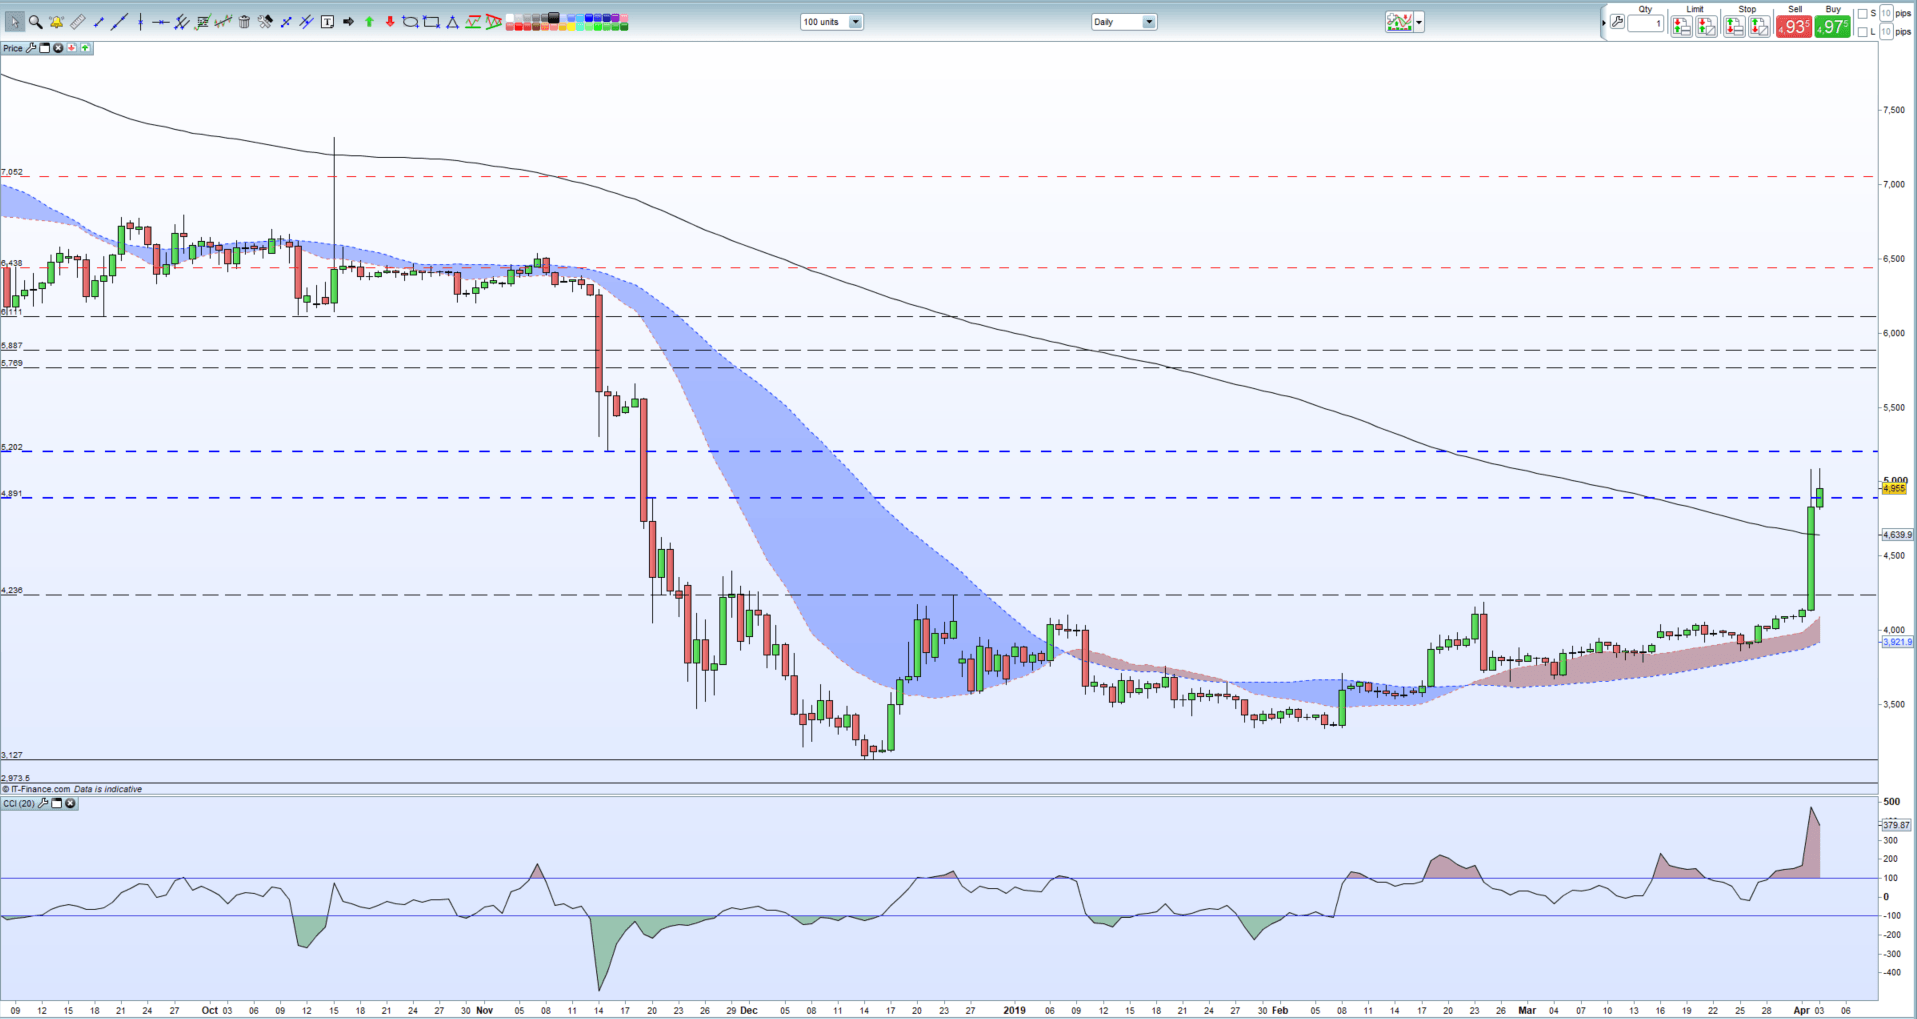
The cryptocurrency market dominated headlines Tuesday after sharp gains across the board with market heavyweight Bitcoin spiking nearly $1,000 higher in a few hours, before edging off its high. The rally took Bitcoin back to highs last seen in November and into a gap on the November 19 bear candle between $4,891 and $5,202. Today’s price action has seen yesterday’s high hold for now and just below the $5,000 level. The chart below highlights two important technical indicators with BTC currently above the important 200-day moving average at $4,645 while the CCI indicator shows Bitcoin in extreme overbought territory. If bitcoin moves and closes below the long-term moving average, a potential pull-back to $4,236, the breakout level, is likely on the cards. A clean break and close above $5,202 could bring old horizontal resistance levels all the way back to $6,000+ back into play.
A Guide to Day Trading Bitcoin & Other Cryptocurrencies.
Bitcoin (BTC) Daily Price Chart (September 2018 – April 3, 2019)
Bitcoin Cash (BCH) Surges to a Fresh Multi-Month High.
Not to be outdone, Bitcoin Cash has surged by 40% in the last 24-hours according to data from Coinmarketcap and is back to levels last seen in mid-November 2018 when the coin forked.

It should also be noted that stable coin Tether (USDT) has traded nearly eleven times its circulating supply/market cap in the last 24-hours. The last time Tether volume surged was in mid-December 2018 when markets traded at or near their recent lows.
The last few weeks has seen low volume and volatility in Bitcoin Cash (BCH) and as such any above normal buying interest, either outright or short-closing, will, and has, produced a sharp market reaction. The 200-day moving average has been breached today and further confirmation of a change in market sentiment will need to be qualified by a close above this level ($255) before looking at further upside. The CCI indicator again shows the coin in extreme overbought territory.
Bitcoin Cash (BCH) Daily Price Chart (September 2018 – April 3, 2019)

IG Client Sentiment shows that retail traders are 78.4% net-long of Bitcoin, a bearish contrarian indicator. However, the recent daily and weekly positional changes give us a mixed trading bias.
--- Written by Nick Cawley, Market Analyst
To contact Nick, email him at nicholas.cawley@ig.com
Follow Nick on Twitter @nickcawley1


