


S&P 500 Outlook Talking Points:
- The S&P 500 faces an inverted yield curve, an indicator which often precedes recessionary periods
- Share buybacks reach an all-time high in 2018, as the majority of companies on the S&P 500 face a blackout period during April
- For a deeper look into the equity space, sign up for my weekly webinar - Stock Market Catalysts in the Week Ahead
S&P 500 Outlook: Dark Clouds Forming Over US Markets
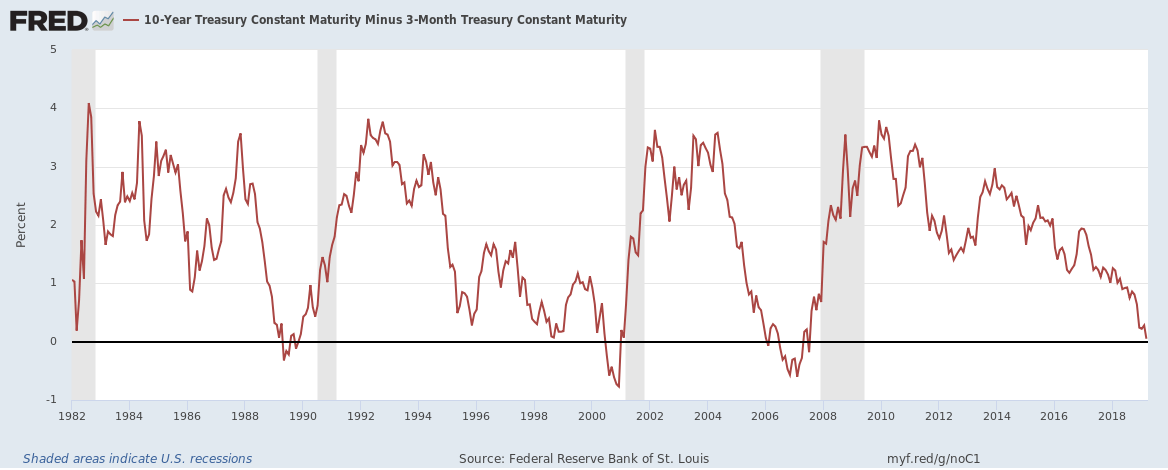
There may be trouble on the horizon for the S&P 500 and other US equity indices as various economic indicators show signs of danger. The most widely-watched yield curve – the ten year to three month - inverted on Friday, spooking investors just days after the FOMC announced it would not hike rates in 2019 and hike once in 2020. Friday’s inversion is the first since mid-2007 for the 3-month and 10-year yields and many market participants view its appearance emblematic of an impending recession.
US Treasury Yield Curve: 10 Year – 3 Month Maturities (1982 to 2019) (Chart 1)
Why Does the US Yield Curve Inversion Matter?
While all inversions of the curve in the last 40 years have seen subsequent recessions within two years, the length and degree of contraction have been mixed. That said, the timeline could be shortened as investors grapple with similarly worrying economic signs elsewhere.
Share Buybacks Reach Record Heights
US equity sentiment may have been dealt another blow on Monday with the release of share buyback data from S&P Dow Jones Indices. The data revealed $806 billion in buybacks for 2018 - the largest amount of capital devoted to stock repurchases in a single year ever – with $223 billion on repurchases during 4Q 2018 alone. Repurchase totals from the most recent quarter mark the fourth consecutive quarterly record. Apple singlehandedly conducted $74.2 billion in buybacks during the year, the most of any single corporation.
S&P 500 Buybacks and Dividends (Chart 2)
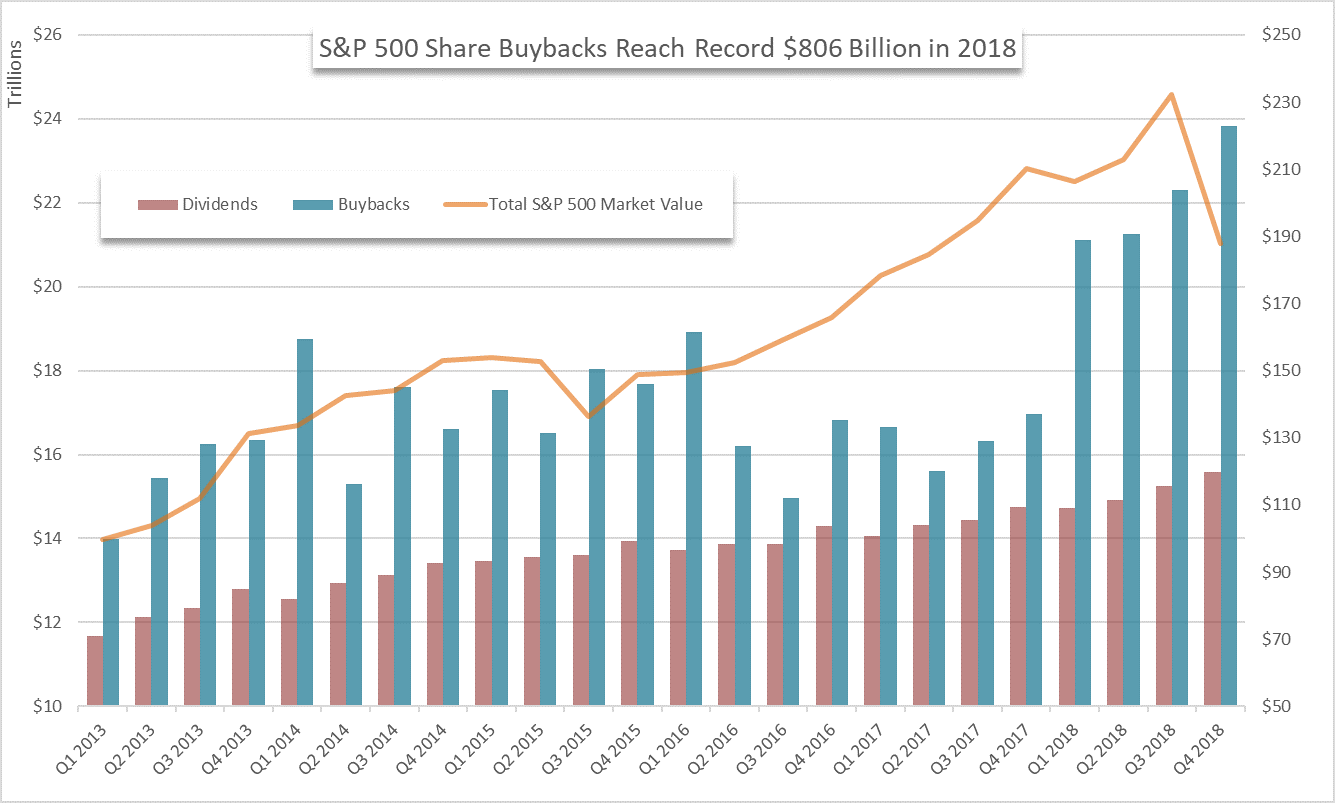
Source: S&P Dow Jones Indices
The blistering pace at which companies have repurchased shares has drawn criticism from some market participants as they argue share prices are being buoyed by the considerable demand from the corporations themselves. Several politicians have also criticized the practice and proposed further regulation on share repurchases.
View the DailyFX Economic Calendar for big events scheduled in the week ahead.
While share repurchases are not inherently negative, some investors argue significant capital expenditure on one’s own stock is indicative that external growth opportunities may be lacking. Whether record buybacks have been detrimental to the S&P 500 or not, their recent infamy has afforded them some influence over investor sentiment.
Buyback Blackouts – An Overblown Risk?
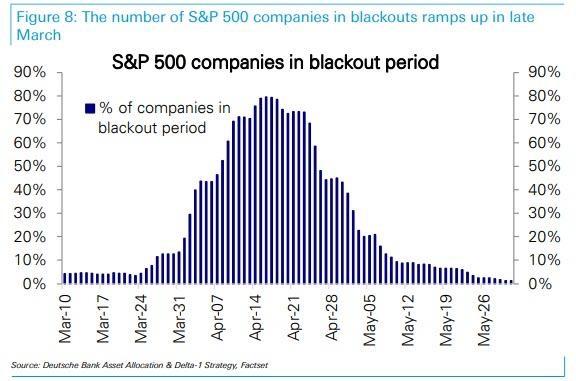
That influence could be leveraged throughout April as the largest share of companies on the S&P 500 enter share blackout periods. A blackout period occurs the month before a company is due to report quarterly earnings and effectively halts a corporation from repurchasing its own shares during the period. With a major buy-side player out of the market, some investors believe blackout periods are bearish for stocks. Coincidentally, the most recent blackout period occurred from October to November during which the S&P 500 shed 180 points or roughly 6.2%.
Buyback Blackout Period (Chart 3)
Despite October’s equity rout, it is unlikely the bearish price action arose from buyback blackouts due to corporate policy regarding share repurchases and relative price performance. As for corporate policy, most companies conduct repurchases on a set schedule – often laid out in a quarterly or annual report – which allows them to continue buybacks during blackout periods. In other words, blackout periods impact immediate repurchases but have no implications on longer-term buyback plans.
Dow Jones Price Chart: Daily Time Frame (January 2018 – March 2019) (Chart 4)

Dow Jones overlaid with ratio of S&P 500 to Buyback Index (SPBUYUP)
Secondly, the S&P Buyback Index – an ETF that tracks the 100 companies with the highest buyback ratios on the S&P 500 - outperformed the broader S&P 500 during the prior blackout period which suggests a lack of buybacks was not to blame for equity turbulence. Furthermore, the index now trails the S&P 500 since early 2018 - despite the theoretical tailwind buyback index constituents should have received.
Learn the differences between the Dow Jones and the S&P 500
With the inversion of the yield curve, it is safe to say concern for the economy is warranted. That said, the current warning signs do not constitute an immediate recession and any prophetic claims may be self-fulfilled as investors exercise extra caution and erroneously point to the upcoming blackout periods as yet another headwind.
--Written by Peter Hanks, Junior Analyst for DailyFX.com
Contact and follow Peter on Twitter @PeterHanksFX
Read more: Dow Jones, FTSE 100 and DAX 30 Fundamental Forecast
DailyFX forecasts on a variety of currencies such as the US Dollar or the Euro are available from the DailyFX Trading Guides page. If you’re looking to improve your trading approach, check out Traits of Successful Traders. And if you’re looking for an introductory primer to the Forex market, check out our New to FX Guide.


