


Gold Price Analysis and Talking Points:
• Deteriorating Economic Outlooks Sparks Global Central Bank Dovish Shift
• What Does This Mean for Gold?
• Fed Reversal is key for Gold to Reach $1400
• Near-Term Gold Outlook
See our quarterly gold forecast to learn what will drive prices throughout Q1!
Deteriorating Economic Outlooks Sparks Global Central Bank Dovish Shift
Since the abrupt shift in stance from the Federal Reserve at the beginning of the year, following the Q4 sell off. Central banks across the globe have followed the lead from the Fed through reigning in expectations of monetary tightening and instead offering a more accommodative stance. Yesterday’s earlier than expected announcement of fresh stimulus from the ECB served as a reminder that the economic outlook is indeed deteriorating.
What Does This Mean for Gold?
Further accommodation from central banks is an optimistic sign for gold bugs, given that easier monetary policy pushes bond yields lower (10yr Bund yield lowest since 2016), thus increasing the allure of gold. As a reminder, since October, the negative bond index has jumped from roughly $6tln, to $9tln, which coincided with gold seeing a sizeable move higher. Alongside this, safe-haven flows will also continue to keep the precious metal elevated given the gloomy outlook.
Fed Reversal is key for Gold to Reach $1400
While the Fed has provided an abrupt shift in monetary policy guidance, from tightening is on autopilot in December, to patience is needed in January. The fact of the matter is that tightening is still ongoing with the Fed’s balance continuing to roll-off $50bln per month up until the year-end. As such, it is not until the Fed begin to signal that the next move in rates could be lower, alongside a pause in the balance sheet unwind that we can expect to see gold prices pushing higher and reaching levels north of $1400 in the longer run.
Fed Fund Futures Call End in Tightening Cycle and Price in Rate Cuts

Source: Thomson Reuters, DailyFX
Near-Term Gold Outlook
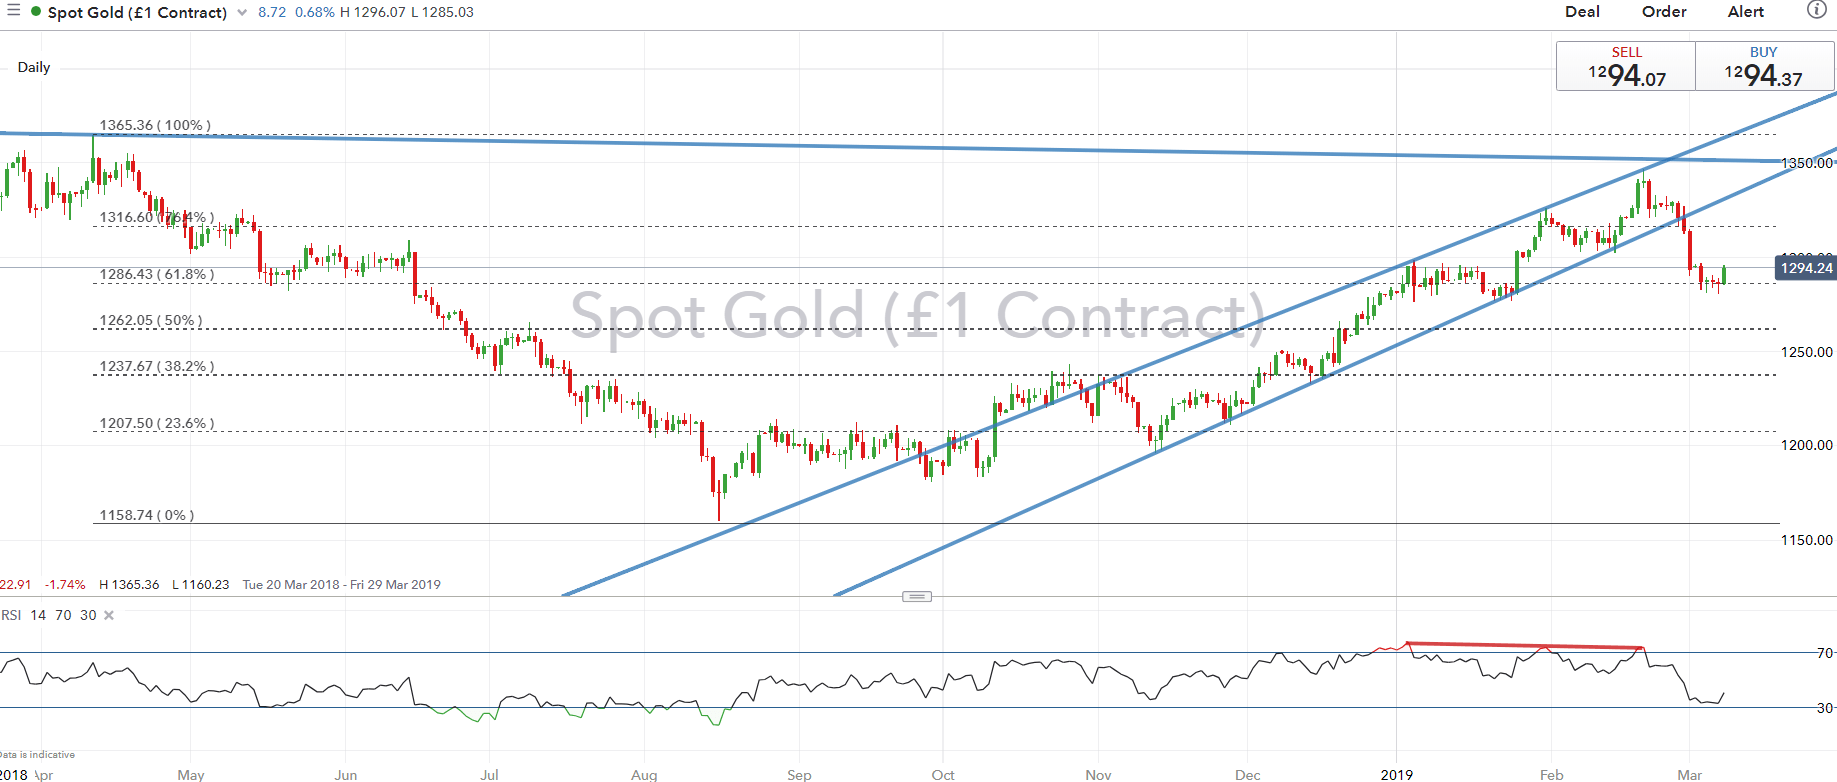
In the short run, given the downside risks to equity markets and in light of the drop in global bond yields, eyes are for a move above $1300, whereby a close above $1302 could see a test of the 76.4% Fib at $1316. On the downside, support at $1280 firm, while stronger support is seen at $1240. Another factor to keep in mind is the price action of gold in yuan terms which has also been a good indicator as to the potential direction of gold.
GOLD PRICE CHART: Daily Time-Frame (Mar 2018-Mar 2019)
RECOMMENDED READING
Gold Price Analysis: Fed Capitulation & Central Bank Buying Spree Maintains Bullish Outlook
What You Need to Know About the Gold Market
GOLD TRADING RESOURCES:
- See our quarterly gold forecast to learn what will drive prices through mid-year!
- Just getting started? See our beginners’ guide for FX traders
- Having trouble with your strategy? Here’s the #1 mistake that traders make
--- Written by Justin McQueen, Market Analyst
To contact Justin, email him at Justin.mcqueen@ig.com
Follow Justin on Twitter @JMcQueenFX


