


Stock Market Talking Points:
- The Dow Jones will look to Friday’s core PCE data and unemployment figures
- Financials will be an important sector to watch in Friday’s trading as inflation expectations shift and bank stocks react accordingly
- As for trading opportunities, the US Dollar may absorb the bigger impact given the nature of the data
See how IG clients are positioned on the Dow Jones, Crude oil and the US Dollar with our free IG Client Sentiment Data.
Friday’s US equity session may be guided by the financial sector as investors get a taste of inflation - and in turn an adjustment to rate forecasts - through the release of core PCE data. Since the equity tumble in October and December, bank stocks have lagged the broader S&P 500 as the market adapted to rate hike expectations. In turn, the lower rate expectations effectively reduced the profit potential for banks as interest rates look to remain low for longer.
Dow Jones Price Chart: Daily Time Frame (January 2017 – February 2019) (Chart 1)

Dow Jones price chart overlaid with ratio of S&P 500 to XLF ETF in red. Fed funds futures in blue.
It is no surprise then that the XLF ETF, a SPDR fund that provides exposure to the US financial sector, has trailed the broader S&P 500 since late December as reflected in the ratio of SPX to XLF. The depths of December coincide with a shift in Fed Chairman Powell’s tone that subsequently saw rate hike expectations plummet. Reinforcing this under-performance, the XLF ETF notched considerable outflows around the time of the dovish shift.
XLF ETF Outflows and Price Overlaid with S&P 500 (Chart 2)
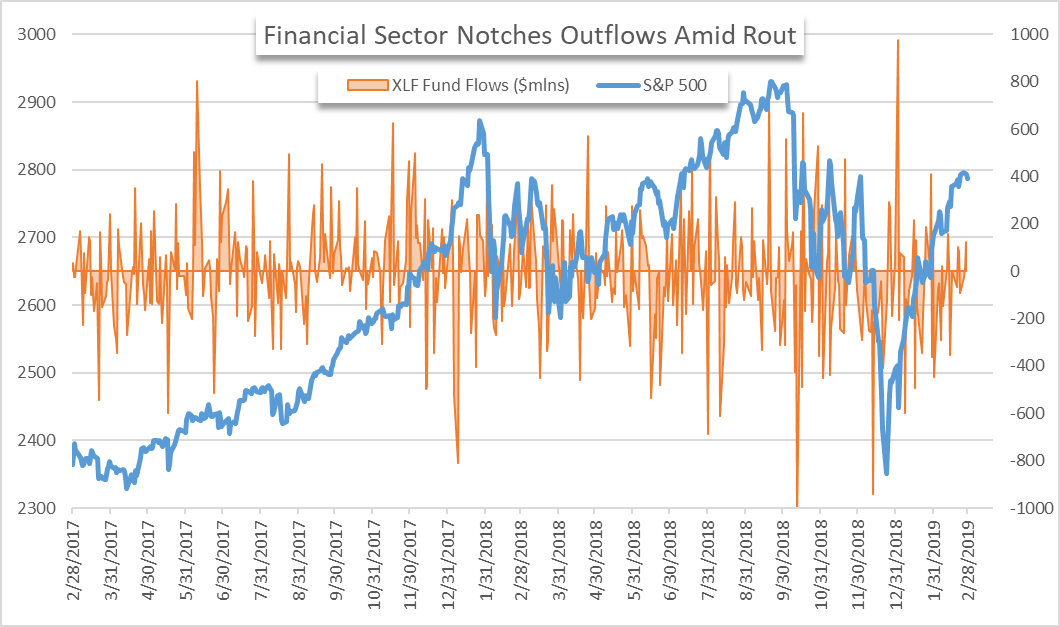
Since October 1st, the XLF ETF has recorded nearly $5.6 billion in outflows. December alone notched roughly $3.1 billion in outflows. Apart from a huge inflow on January 2nd, the fund has come under immense selling pressure as the outlook for the financial sector shifted on the Fed’s new tone. While some of the selling is attributable to broader equity pressure, it is important to note the sustained outflows even as the broader equity market rebounded in January and February. Those months saw another $1.5 billion exit XLF.
That said, US economic data has been relatively strong in recent weeks. US fourth quarter GDP surprised analysts and regional data along with sentiment indicators have rebounded considerably from January. Should Friday’s core PCE data deliver a similar surprise, financials will be the sector to watch as investors gauge the data’s impact on monetary policy and the knock-on effect it could have for individual bank stocks.
Looking to take your trading to the next level? Check out our free Advanced Trading Guides.
Together, the financial sector could work to buoy or pressure the Dow Jones. Similarly, the inflationary takeaways from the data could impact the Dollar to a greater extent than the Dow. Given the nature of Friday’s data and the potential for a market reaction, the US Dollar may be a more appropriate vehicle to source volatility in tomorrow’s session.
US Dollar Price Chart (DXY): 1-Hour Time Frame (January 28 – February 28) (Chart 3)
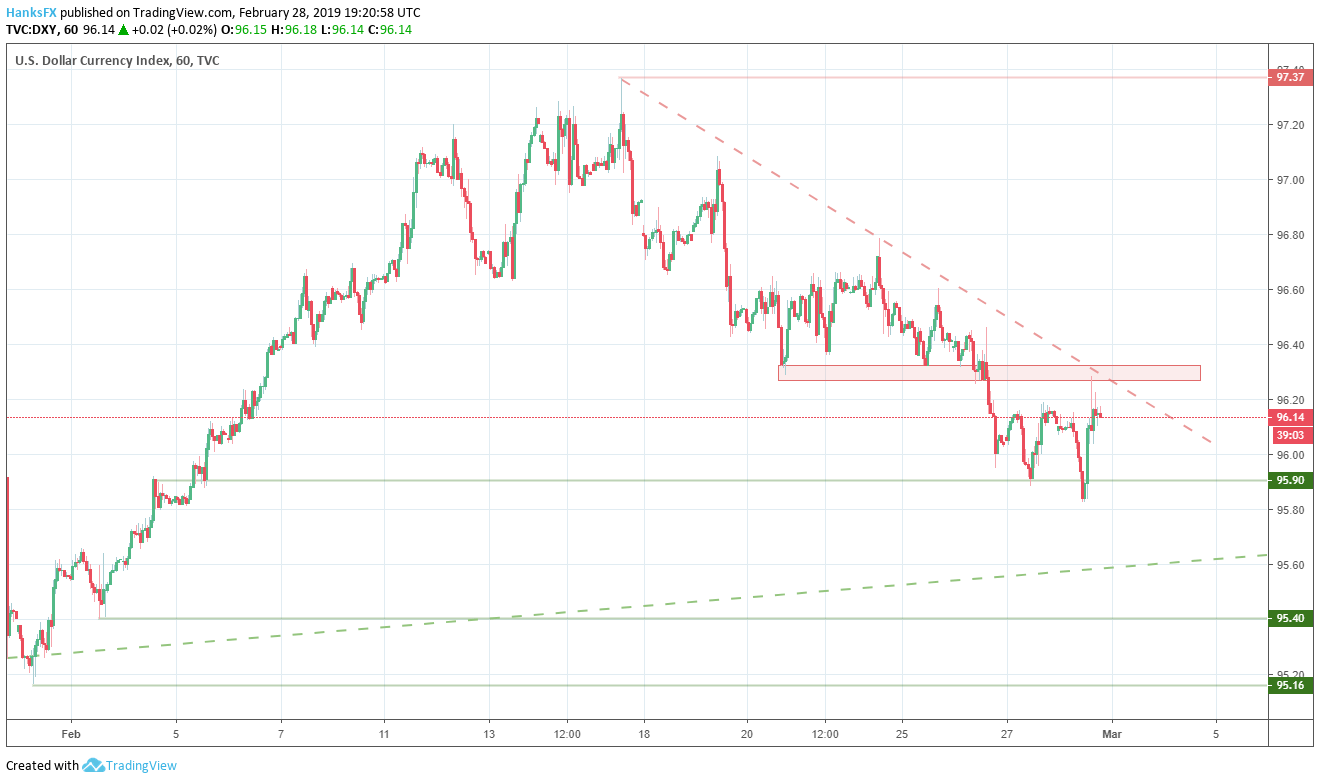
The Dollar has been pressured the last two weeks, retreating from 97.37 to lows around 95.80 on Thursday. Poor PCE data could spur a continuation of the recent downtrend, while a surprise to the topside could propel the Greenback to test the resistance from the recent decline highlighted in the chart above. Check out a deeper analysis of the US Dollar for different perspectives on opportunities through Friday’s session.
--Written by Peter Hanks, Junior Analyst for DailyFX.com
Contact and follow Peter on Twitter @PeterHanksFX
Read more: EURUSD Continues Towards Range Resistance; GBPUSD Breakout Stalls
DailyFX forecasts on a variety of currencies such as the US Dollar or the Euro are available from the DailyFX Trading Guides page. If you’re looking to improve your trading approach, check out Traits of Successful Traders. And if you’re looking for an introductory primer to the Forex market, check out our New to FX Guide.


