Gold (XAU) Price, News and Chart:
- Gold may target $1,365/oz. high as the US dollar takes a breather.
- Retail remain long but RSI warns that the precious metal is becoming overbought.
Q1 2019 Gold Forecast and Top Trading Opportunities
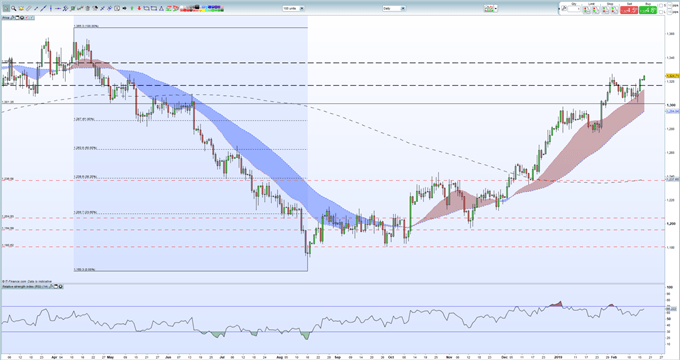
After a couple of attempts this month to break below the strong support around $1,303/oz. gold bulls have reasserted themselves and pushed the precious metal sharply higher and to a new monthly high. A weaker US dollar has let gold run higher as US-China trade talks continue with talk that if the two are close to agreement, then the March 1 US tariff hikes on Chinese imports may be pushed down the line to help negotiations.
While US dollar weakness is helping fuel gold’s run higher, political risk remains - including EU growth, Brexit and now Spanish elections - and may underpin the latest move. One negative may be that any sell-off in the Euro will see flows going back into the USD, weighing on the gold. Retail sentiment shows that traders remain long of gold – normally a contrarian bearish indicator – while on the daily chart the RSI indicator is starting to flash an overbought warning and should be watched. On the downside, the $1,303/oz. area has held firm ever since it was broken on January 25 and is followed by moving average support at $1,295/oz. and 61.8% Fibonacci retracement at $1,287/oz.
How to Trade Gold – Top Strategies and Tips
Gold Daily Price Chart (March 2018 – February 18, 2019)

Gold Prices Stopped Short of Resuming Dominant Uptrend, Watch RSI
Retail traders are 70.3% net-long Gold according to the latest IC Client Sentiment Data, a bearish contrarian indicator. However, recent changes in daily and weekly sentiment suggest that the price of gold may move higher despite trader’s long-positions.
Traders may be interested in two of our trading guides – Traits of Successful Traders and Top Trading Lessons – while technical analysts are likely to be interested in our latest Elliott Wave Guide.
What is your view on Gold – bullish or bearish?? You can let us know via the form at the end of this piece or you can contact the author at nicholas.cawley@ig.com or via Twitter @nickcawley1.


