Sterling and GBPUSD:
- Moving average crossover may fuel renewed GBPUSD bullish sentiment.
- Prior ‘Death Cross’ foretold GBPUSD sell-off.
See how our Q1 2019 Trading Forecast for GBP can help you when trading.
GBPUSD Chart Eyes Potential Upside Momentum
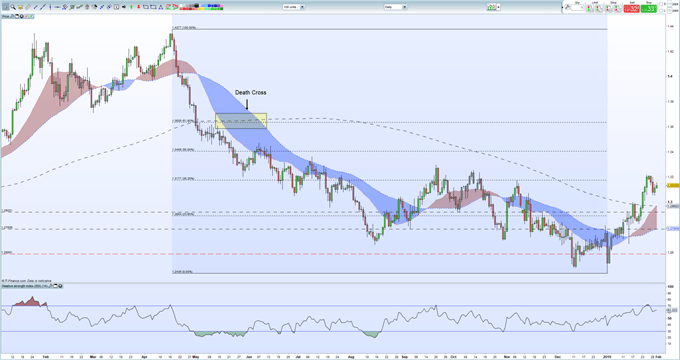
A closely followed technical indicator is forming on the daily GBPUSD chart and may renew bullish sentiment in the pair.
A ‘Golden Cross’ on a chart is a bullish indicator and occurs when short-term moving average breaks above its longer-term average, highlighting positive market sentiment. On the chart below, the 20-dma has just broken the 200-dma and if the 50-dma also breaks above the longer-term average – around 2 cents away – bullish sentiment will be refuelled. While not a guarantee of higher prices, if the crossover does occur, and is confirmed with higher trading volume, it should prompt further positive sentiment. The initial target lies at 1.300 ahead of1.3406 – 50% Fibonacci retracement – before the 61.8% retracement level at 1.3635 comes into focus.
The chart also shows the price action after a ‘Death Cross’ – the opposite of a Golden Cross - occurred in mid-2018 with GBPUSD falling from around 1.3600 to 1.2435 over a six-month period.
Elsewhere on the chart, GBPUSD trades comfortably above the 200-dma, providing initial support around 1.2970, with secondary support seen at 1.2894, the 23.6% Fibonacci retracement level.
Retail traders are net-short of GBPUSD – 47.4% - according to the IG Retail Sentiment Indicator. See what this means and how it can help you make better informed trading decisions.
GBPUSD Daily Price Chart (January 2018 - January 31, 2019)

Traders may be interested in two of our trading guides – Traits of Successful Traders and Top Trading Lessons – while technical analysts are likely to be interested in our latest Elliott Wave Guide.
What is your view on GBPUSD – bullish or bearish?? You can let us know via the form at the end of this piece or you can contact the author at nicholas.cawley@ig.com or via Twitter @nickcawley1.


