


Market risk, news and analysis:
- Stock and oil prices are gaining ground as hopes rise that a full-scale trade war between the US and China can be avoided.
- Meanwhile, US Treasury bond prices and the markets’ fear index are falling as safe havens lose their appeal.
Risk appetite improves
Traders are switching from safe havens like US Treasury notes and bonds into riskier assets such as stocks and oil as their willingness to increase risk has been lifted by hopes that a full-scale US-China trade war can be avoided.
Trade war fears have been reduced by news that talks between the US and China were extended for an unexpected third day before concluding, with US President Donald Trump saying on Twitter that “Talks with China are going very well!”
That, plus reports that China could boost domestic spending, have given a further boost to European and other stock markets, with London’s FTSE 100, Frankfurt’s DAX and Paris’s CAC 40 up by between 0.6% and 1.0% in early European business.
FTSE 100 Price Chart, Daily Timeframe (September 21, 2018 – January 9, 2019)
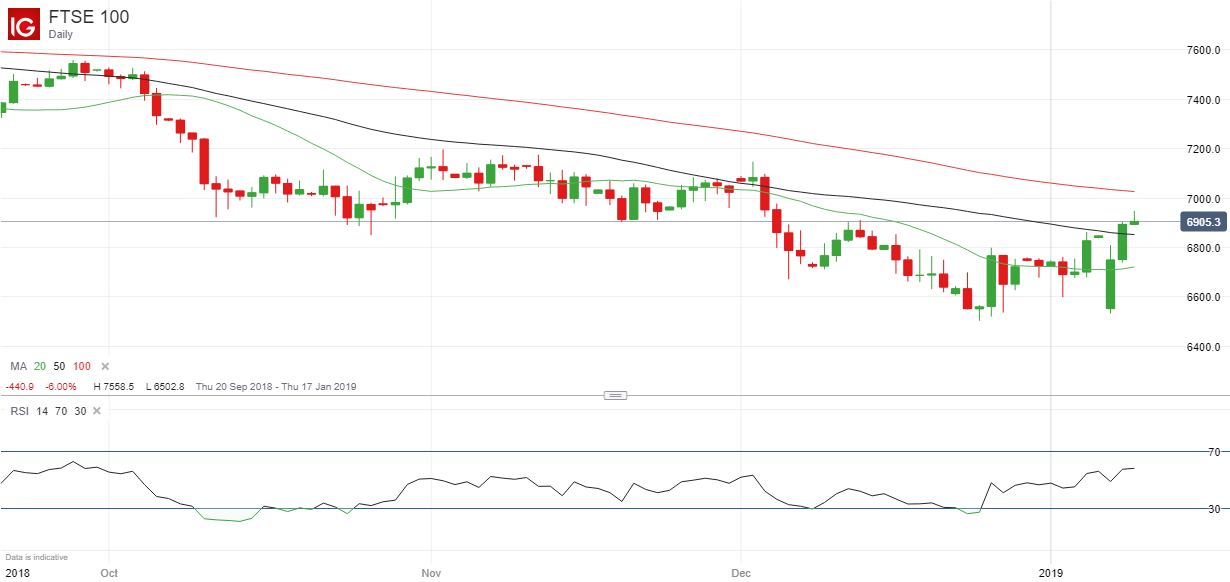
Chart by IG (You can click on it for a larger image)
Similarly, crude oil prices are rising despite news that US fuel stockpiles surged last week according to data from the American Petroleum Institute and shrugging off the continuing argument over the building of a wall between the US and Mexico and the resulting partial US government shutdown.
US crude oil Price Chart, Daily Timeframe (August 29, 2018 – January 9, 2019)

Chart by IG (You can click on it for a larger image)
As the chart above shows, the US benchmark crude oil price has now broken above the psychologically important $50 per barrel mark.
On the other side of the coin, the VIX index that measures the volatility of US stocks and is known as the markets’ fear gauge has fallen to only just above the 20 level for the first time in a month. US Treasury bond prices have fallen too as speculators move from low-risk government bonds to higher risk assets – lifting the 10-year note yield to its highest level so far this year.
Judging by the CME FedWatch tool, there is now a probability of 64.7% that the US Federal Funds rate will still be at 2.25%-2.50% by the end of this year whereas previously more hikes had been expected. That, in turn, reflects more dovish comments recently by Jerome Powell, who chairs the US Federal Reserve.
Resources to help you trade the forex markets:
Whether you are a new or an experienced trader, at DailyFX we have many resources to help you:
- Analytical and educational webinars hosted several times per day,
- Trading guides to help you improve your trading performance,
- A guide specifically for those who are new to forex,
- And you can learn how to trade like an expert by reading our guide to the Traits of Successful Traders.
--- Written by Martin Essex, Analyst and Editor
Feel free to contact me via the comments section below, via email at martin.essex@ig.com or on Twitter @MartinSEssex


