Brent Oil and US Crude Oil Prices and Charts:
- US-China trade talk hopes provide crude oil with a strong tailwind.
- Upcoming technical resistance may stall, but not stop, the latest rally.
Crude Oil Pushing Higher on Positive Sentiment Shift
Crude oil pushed higher in early turnover as trade talks between the world’s two largest economies took a positive shift. Trade talks between the US and China were extended into a third day as both sides made conciliatory noises about ending the trade dispute that has weighed heavily on global markets. The originally planned two-day meeting was extended as talks continue on US agricultural goods and US access to Chinese markets, according to media reports.
Crude Oil Price Likely to Push Higher on US – China Trade Hopes
And according to Arab Petroleum Investments Corporation (Apicorp), barring a sharp slowdown in the global economy, the price of crude should trade between $60/bbl. and $70/bbl. by H2 2019 as the market continues to balance itself out. In addition, the latest API report showed a much larger-than-expected drawdown in US crude oil inventories – 6.1 million bbl. per week compared to expectations of 2.7 million bbl. – supporting the price of US crude.
How to Trade Oil – Crude Oil Trading Strategies
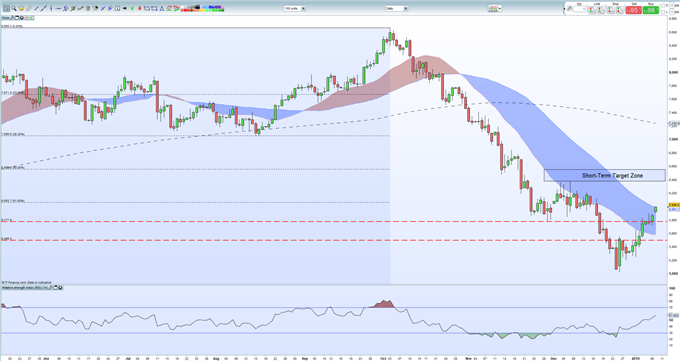
The latest daily price chart shows Brent touching $60/bbl. a three-week high, and continuing its rally of the December 26 low of $50.25/bbl. Oil is also trying to trade above both the 20- and 50-day moving average and is eyeing the 61.8% Fibonacci retracement at $60.63/bbl. Above here a new target area open ups between the December 7 high at $63.80/bbl. and the 50% Fibonacci retracement at $65.60/bbl.
Brent Crude Oil Daily Price Chart (May 2018 - January 9, 2019)

WTI vs Brent – Top 5 Differences Between WTI and Brent Crude Oil
Traders may be interested in two of our trading guides – Traits of Successful Traders and Top Trading Lessons – while technical analysts are likely to be interested in our latest Elliott Wave Guide.
What is your view on Oil – bullish or bearish?? You can let us know via the form at the end of this piece or you can contact the author at nicholas.cawley@ig.com or via Twitter @nickcawley1.


