


Talking Points:
- ISM Non-Manufacturing PMI falls to 57.6 from 60.7, missing expectations of 59.0.
- The ISM Services Index miss reiterates investor concern over the pace of economic growth
- S&P500 and USD continue Friday’s trend
The US ISM Non-Manufacturing for December 2018 stumbles to 57.6 from 60.7 in the prior period. The fall in the gauge reverberates the disappointing reading on the Manufacturing PMI last week.
US ISM SERVICES INDEX PRICE CHART: MONTHLY TIMEFRAME (DECEMBER 2016 TO DECEMBER 2018) (Chart 1)

The decline puts the ISM Services Index at the lowest since July but remains in expansion territory for the 107th consecutive month. The change in the indicator was driven primary by a drop in supplier deliveries in addition to the slowing trend of inventory buildup and order backlog. Survey respondents commented that they are “Reducing inventory to be more in line with sales” and “Deleting surplus inventory before year’s end.”
Mining, real estate, management services, and wholesale trade are the four industries reporting declines while eleven industries reported growth led arts, entertainment and recreation, as well as retail trade. The employment component also slowed from 58.4 to 56.3.
A bright spot in the report was the faster growth in new orders rising 0.2 to 62.7 and new export orders jumping 2.0 to 59.5.
As for prices paid, 18 percent of respondents state that they experienced an increase while 74 percent specified no change with the remaining 8 percent indicating lower prices.
US S&P500 INDEX PRICE CHART: 1-MINUTE TIMEFRAME (JANUARY 7, 2019 INTRADAY) (CHART 2)
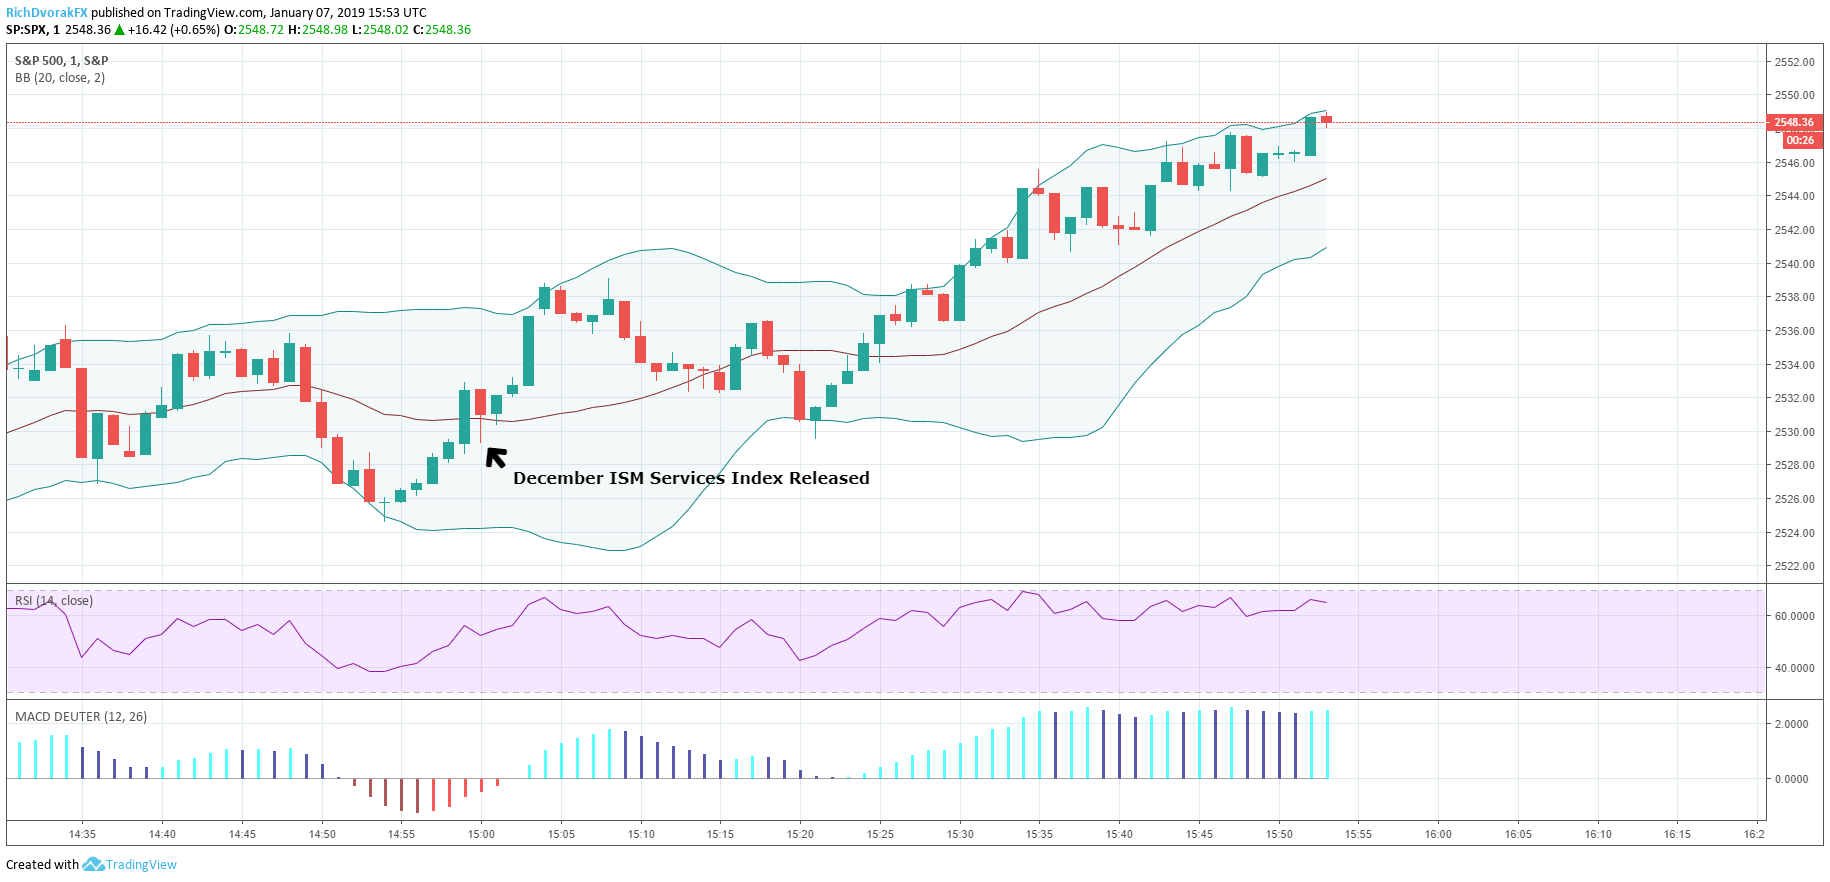
Stocks opened up slightly higher Monday morning and changed little after the ISM Services Index report. Equities are continuing their rebound Friday after dovish comments from Fed Chairman Jerome Powell provided investors with some relief that the central bank could hold off on further normalization of monetary policy. This news is also causing the US Dollar to extend its slide.
DXY US DOLLAR INDEX PRICE CHART: 5-MINUTE TIMEFRAME (JANUARY 7, 2019 INTRADAY) (CHART 3)

For additional news, read up on the latest crucial Brexit information here
---
Written by Rich Dvorak, Junior Analyst for DailyFX
Follow on Twitter @RichDvorakFX
Check out our Education Center for more information on Currency Forecasts and Trading Guides.


