


US Dollar Basket (DXY) May Re-Test Recent High
- Bullish engulfing candlestick made yesterday.
- US ISM data and the Non-Farm Payrolls releases this week
- Partial US government shutdown still weighs on the USD.
The DailyFX Q1 2019 Trading Forecasts and Guides are now available to download for free.
US Dollar Basket (DXY) to Brush Aside Asian Sell-Off
The US dollar is looking to re-bound from Wednesday’s Asian sell-off and re-test the 96.59 – 96.60 level last seen mid-December 2018. While US Treasury yields continue to fall due to safe-haven buying, the US currency continues to keep its recent strength, as global equity markets are under-pressure from lofty valuations, missed expectations and global growth fears. Apple has dropped from $232 in early November 2018 to a current quote of $146, while Tesla has fallen from a mid-December level of $376 to around $305. In addition, the partial US government shutdown is not helping sentiment, as US President Donald Trump continues to demand funding for the US/Mexico border wall.
Ahead, important US data releases include US ISM data and the monthly US payroll release (NFPs).

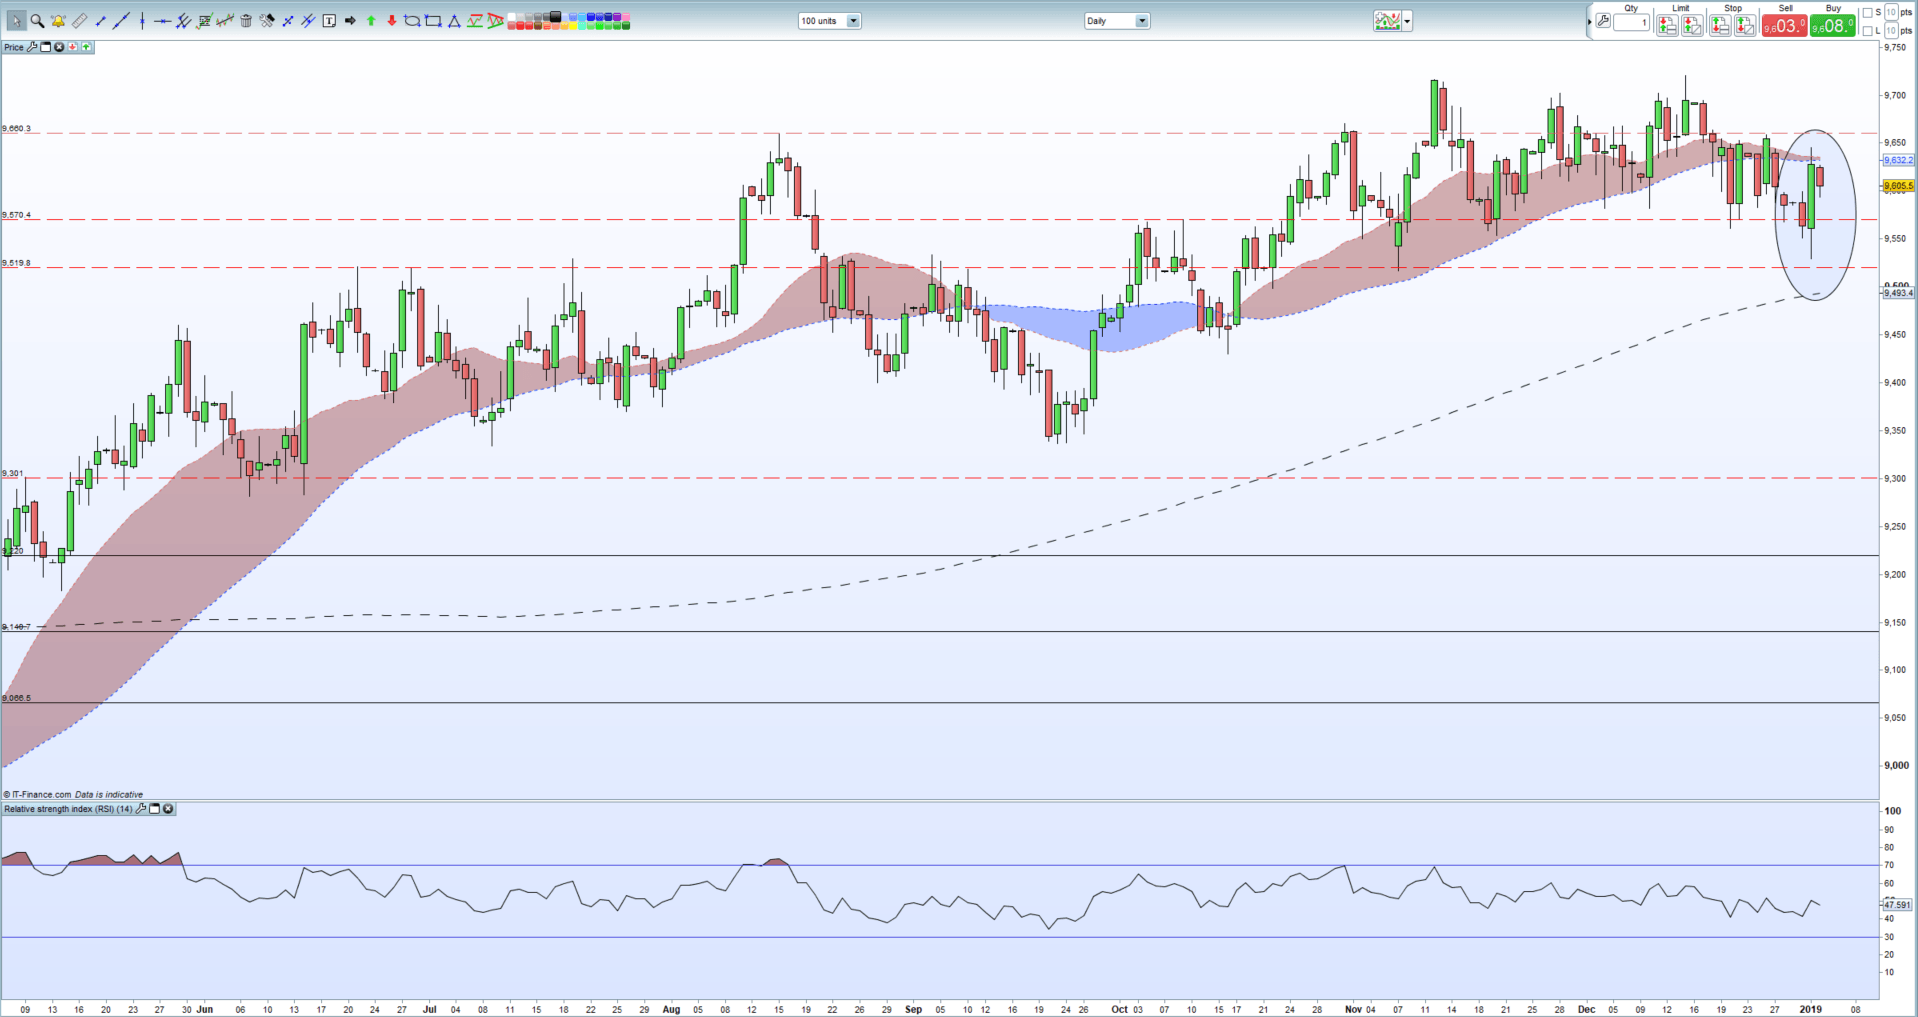
The US Dollar Basket (DXY) daily chart shows a bullish engulfing candle formed yesterday, a positive sign for US dollar bulls. Resistance starts between 96.30 and 96.35, the 20- and 5-day moving average cluster, before the 96.60 double-top made on August 15 and December 26, 2018.
US Dollar Basket (DXY) Daily Price Chart (May 2018 – January 3, 2019)
IG Client Sentiment Data show investors how investors are currently positioned in a wide range of currencies and assets.
Traders may be interested in two of our trading guides – Traits of Successful Traders and Top Trading Lessons – while technical analysts are likely to be interested in our latest Elliott Wave Guide.
What is your view on the US dollar – bullish or bearish?? You can let us know via the form at the end of this piece or you can contact the author at nicholas.cawley@ig.com or via Twitter @nickcawley1.


