


AUDUSD price, news and analysis:
- Further signs of a slowing Chinese economy, the US-China trade war and domestic economic weakness will likely put the AUDUSD price under further downward pressure.
- The 2016 lows for the pair are now a possible target.
AUDUSD price weakness may resume
After a short period of relative stability, the AUDUSD price is threatening to break lower again, with the January 2016 lows around 0.6827/8 a possible medium-term target.
AUDUSD Price Chart, Daily Timeframe (July 23, 2018 – January 2, 2019)
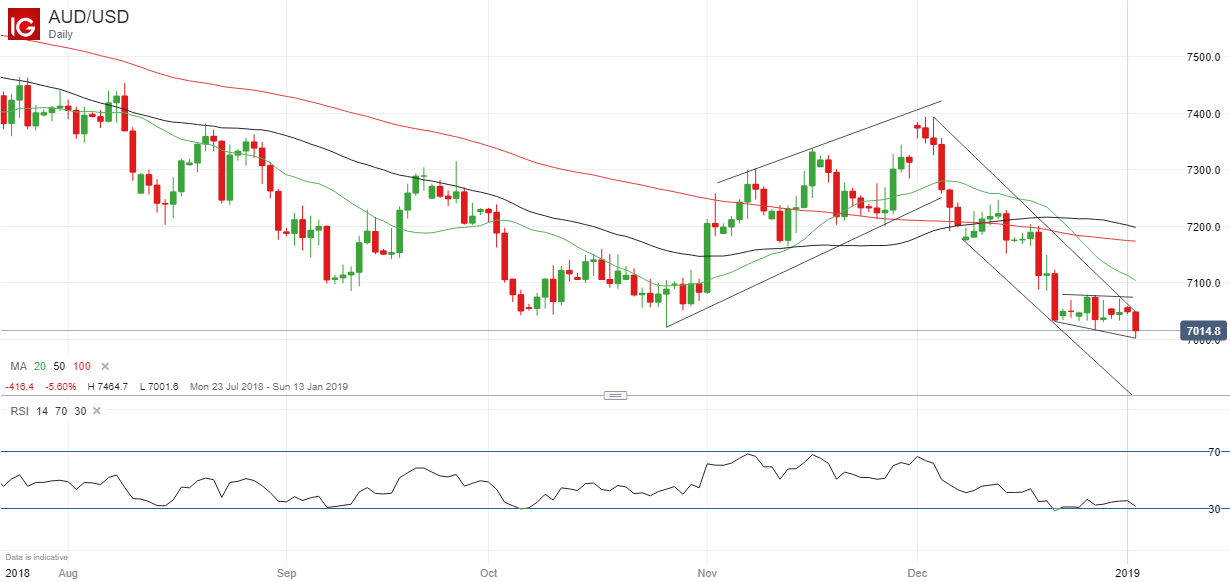
Chart by IG (You can click on it for a larger image)
The AUDUSD price is regarded as a proxy for the Chinese economy because of the importance of the Chinese market for Australian exports, and signs are growing of a Chinese slowdown. The Caixin/Markit Manufacturing Purchasing Managers’ Index (PMI) for December, released Wednesday, fell to 49.7 from 50.2 in November, marking the first contraction since May 2017.
That followed news Monday that the official PMI– the first snapshot of China’s economy each month – fell to 49.4 in December, also below the 50-point level that separates growth from contraction. Moreover, the ongoing US-China trade war remains a concern for economists.
Australian economy
That’s bad news for Australian exporters to China and adds to concerns about the domestic Australian economy. Australian home prices dropped by nearly 5% in 2018, marking their worst year since 2008, led by tighter credit conditions and waning investor interest. Analysts expect the weakness to persist this year.
Moreover, a global economic slowdown would hit the open Australian economy particularly hard and the Reserve Bank of Australia is not expected to tighten Australian interest rates until well into next year.
The markets more generally are in a “risk off” mood at the moment, with stocks and other high-yielding assets hit by China’s slowdown, trade disputes and the US Government’s partial shutdown. That can be seen most clearly in the Australian Dollar’s performance against the safe-haven Japanese Yen, with the AUDJPY price also at risk of falling further.
AUDJPY Price Chart, Daily Timeframe (September 14, 2018 – January 2, 2019)
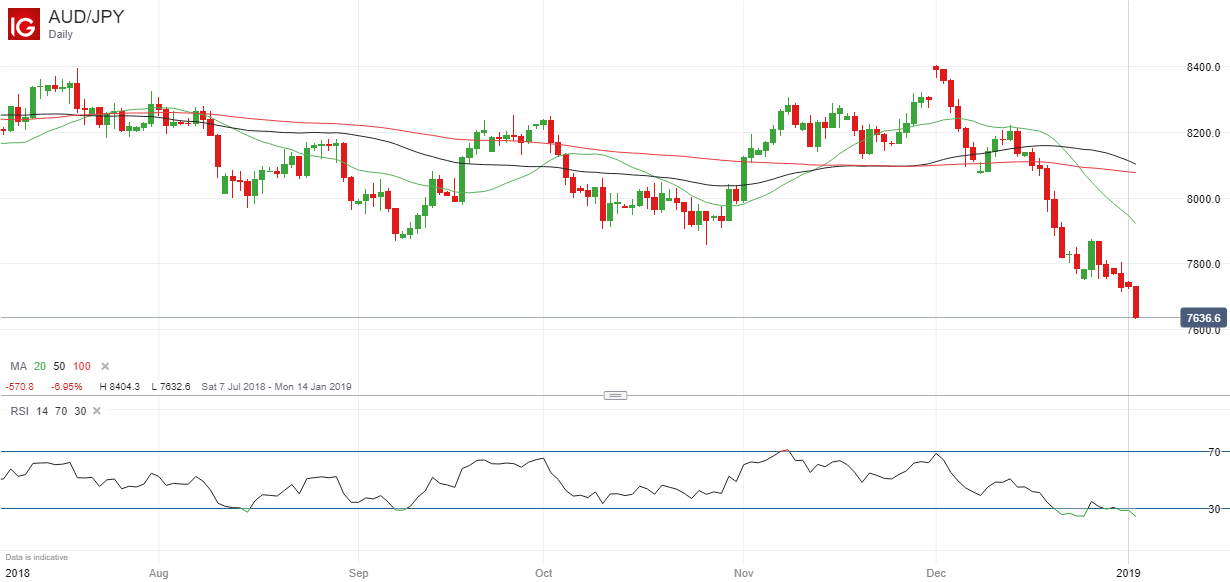
Chart by IG (You can click on it for a larger image)
There’s more to read on the AUD here
Resources to help you trade the forex markets:
Whether you are a new or an experienced trader, at DailyFX we have many resources to help you:
- Analytical and educational webinars hosted several times per day,
- Trading guides to help you improve your trading performance,
- A guide specifically for those who are new to forex,
- And you can learn how to trade like an expert by reading our guide to the Traits of Successful Traders.
--- Written by Martin Essex, Analyst and Editor
Feel free to contact me via the comments section below, via email at martin.essex@ig.com or on Twitter @MartinSEssex


