


USD Analysis and Talking Points
- Federal Reserve QT to Spur Short Term USD Rise
- Fed balance sheet will lead to a net negative impact on US liquidity of $18.2bln on the final trading day
Federal Reserve Quantitative Tightening
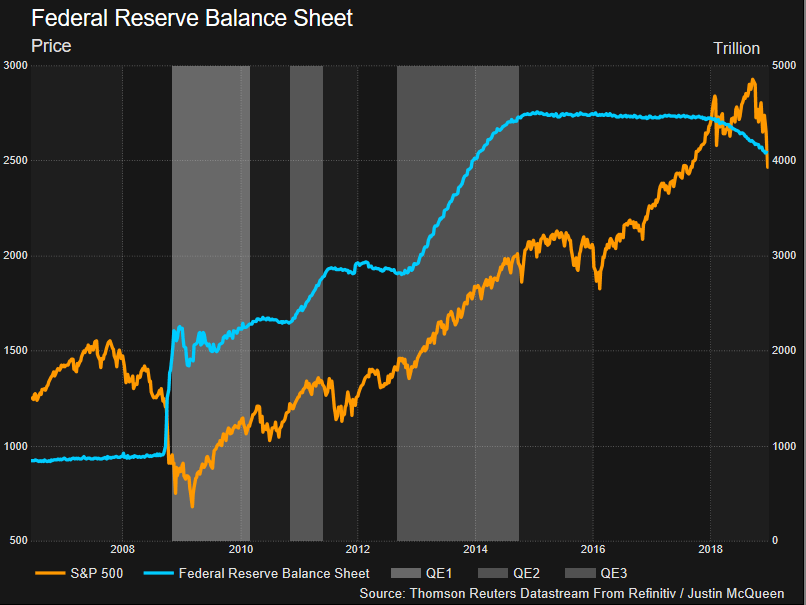
In 2017 the Federal Reserve announce that they would slowly begin to shrink the balance sheet from October, starting at a rate of $10bln/month and working up to a maximum of $50bln, in order to unload the $4.5tln of bonds acquired by the central bank through its QE program. As such, the Fed are now in the process of letting the debt roll off its balance sheet by holding the debt to maturity and not re-investing the proceeds. Consequently, this typically creates a demand for Dollars, while also providing a drain on liquidity.
Throughout 2018, the unwind of the Federal Reserve’s balance sheet has coincided with an increase in equity market volatility, while equity prices have also taken a noticeable leg lower with major benchmarks hovering in bear market territory. If QE typically sparks a rally in equity prices, then one can assume that QT is likely to have the reverse effect.
Federal Reserve Total Assets vs S&P 500
Short term Impact on the S&P 500
Typically, on days with a large and negative impact on USD liquidity, risk sentiment has been softer. December 31st will mark the next redemption day in which the shrinking of the Fed balance sheet will lead to a net negative impact on USD liquidity by around $18.2bln.
| Dates | Par Value | Daily Impact on US Liquidity | Monthly Cap | Monthly Cap Agency Securities | S&P 500 Performance |
|---|---|---|---|---|---|
| Oct 31st 2017 | $8.7bln | -$6bln | $6bln | $4bln | 0.1% |
| Nov 15th 2017 | $11bln | -$3.5bln | $6bln | $4bln | -0.6% |
| Nov 30th 2017 | $7.9bln | -$2.5bln | $6bln | $4bln | 0.8% |
| Dec 31st 2017 | $17.5bln | -$6bln | $6bln | $4bln | 0.8% |
| Jan 31st 2018 | $27.6bln | -$12bln | $12bln | $8bln | 0.1% |
| Feb 15th 2018 | $16.6bln | -$4.1bln | $12bln | $8bln | 1.2% |
| Feb 28th 2018 | $32bln | -$7.9bln | $12bln | $8bln | -1.1% |
| Mar 31st 2018 | $31.2bln | -$12bln | $12bln | $8bln | -2.2% |
| Apr 30th 2018 | $30.4bln | -$18bln | $18bln | $12bln | -0.8% |
| May 15th 2018 | $26.2bln | -$8.6bln | $18bln | $12bln | -0.7% |
| May 31st 2018 | $28.5bln | -$9.4bln | $18bln | $12bln | -0.7% |
| Jun 30th 2018 | $30.5bln | -$18bln | $18bln | $12bln | 0.3% |
| Jul 31st 2018 | $28.5bln | -$24bln | $24bln | $16bln | 0.5% |
| Aug 15th 2018 | $23.1bln | -$12.6bln | $24bln | $16bln | -0.8% |
| Aug 31st 2018 | $20.9bln | -$11.4bln | $24bln | $16bln | 0.0% |
| Sep 30th 2018 | $19bln | -$19bln | $24bln | $16bln | -0.2% |
| Oct 31st 2018 | $22.9bln | -$22.9bln | $30bln | $20bln | 0.1% |
| Nov 15th 2018 | $34.3bln | -$17.4bln | $30bln | $20bln | 1.0% |
| Nov 30th 2018 | $24.9bln | -$12.9bln | $30bln | $20bln | 0.8% |
| Dec 31st 2018 | $18.2bln | -$18.2bln | $30bln | $20bln |
Source: Federal Reserve
On SOMA days, the 5&P 500 has typically lost 0.1% during US market hours. That said, with the reduction of liquidity taking a notable effect on equity markets, the Federal Reserve may have to rethink its strategy and potentially announce a temporary pause in 2019 with regard to reducing the balance sheet.
S&P 500 TRADING RESOURCES:
- Just getting started? See our beginners’ guide for FX traders
- Having trouble with your strategy? Here’s the #1 mistake that traders make
--- Written by Justin McQueen, Market Analyst
To contact Justin, email him at Justin.mcqueen@ig.com
Follow Justin on Twitter @JMcQueenFX


