

Not the most commonly-traded currency pair but fundamentally and technically this trade is one to consider for the longer-term in 2019. One of the main drivers for this trade is the expected future interest-rate differential between the two currencies. Both the Reserve Bank of New Zealand (RBNZ) and the Bank of Canada (BOC) have their key lending rate currently pegged at 1.75%, but this is set to change. The market is currently pricing in two 0.25% rate hikes in Canada in 2019 while the first RBNZ interest rate hike is expected in 2020 at the earliest.
This should not only underpin the Canadian dollar against the New Zealand dollar but also strengthen it through 2019, pushing NZD/CAD lower as the rate differential between the two central banks widens.
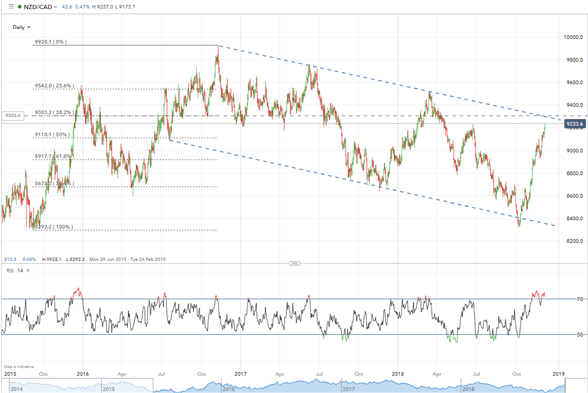
The chart below shows how NZD/CAD has pushed higher recently - due primarily to a weak oil complex - and this is expected to slow or reverse shortly as oil stabilizes. The downward channel in place off the late 2016 high remains in place and should start to apply downside pressure shortly, while the 38.2% Fibonacci retracement of the late 2015-late 2016 rally cuts across the down channel around 2 points from the spot price. The RSI indicator at the bottom of the chart is in extreme overbought territory, flashing a further sell-signal. The pair would need to break and close above 95.17 – the March 2018 high – to invalidate the set-up.
NZD/CAD Price Chart: Daily Timeframe (June 2015 to December 2018)
To see all of the analysts Top Trade Ideas for 2019 and Top Lessons from 2018, download the guides on the DailyFX Trading Guides Page.