


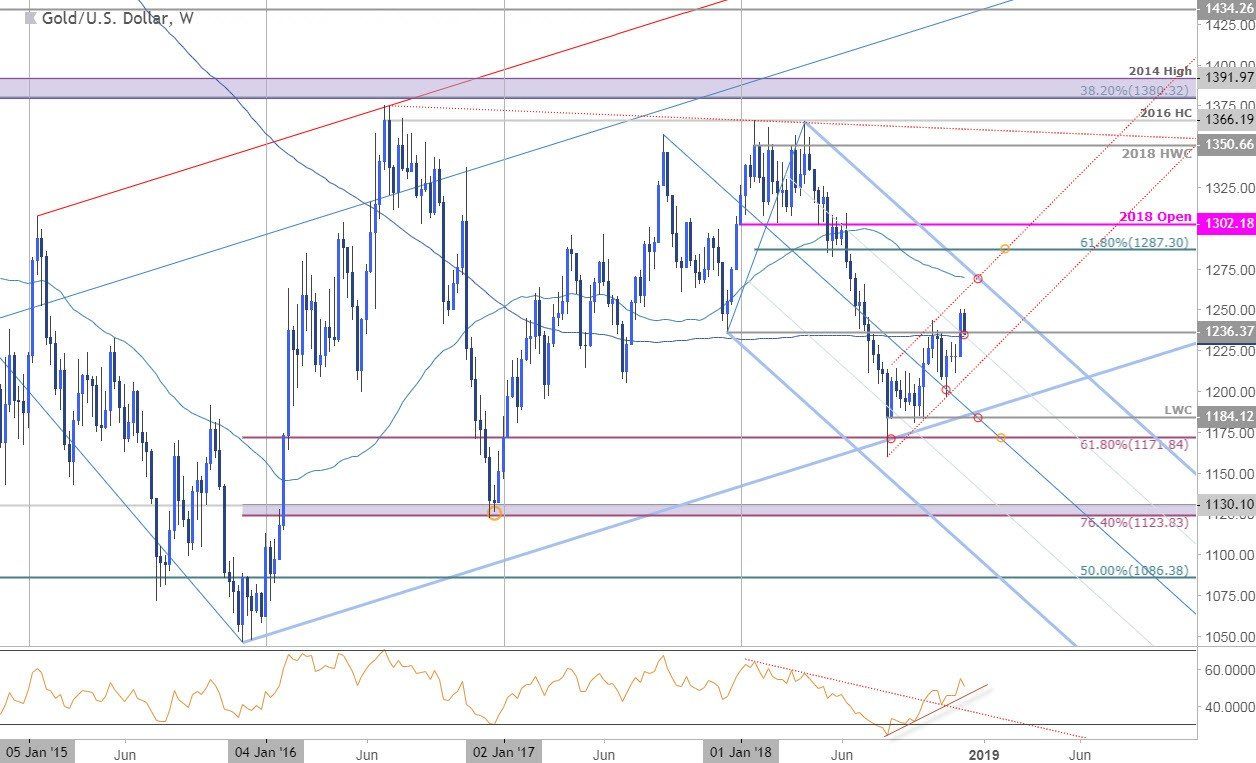
Gold Weekly Price Chart (XAU/USD)
Data Source: TradingView. Prepared by Michael Boutros
Heading into the start of 2018 our ‘bottom line’ for Gold noted that, “the immediate risk heading into next year is for a decline to ultimately offer more favorable long-opportunities.” Price registered a low at 1160 this year with price reversing off multi-year pitchfork support of the formation extending off the 2013/2015 lows. Gold has continued to trade within the confines of this near-term descending formation off the 2017/2018 highs and heading into next year, we’re looking for a low while above the 2018 low-week close at 1184. Initial resistance targets are eyed at the highlighted confluence region around the 52-week moving average at 1270 backed by 1287. Ultimately a breach above the yearly open at 1302 would be needed to put the broader long-bias back in play. Broader bullish invalidation rests at 1171. Bottom line: look for a low above parallel support next year with a breach of the descending pitchfork needed to clear the way for a larger advance in gold.
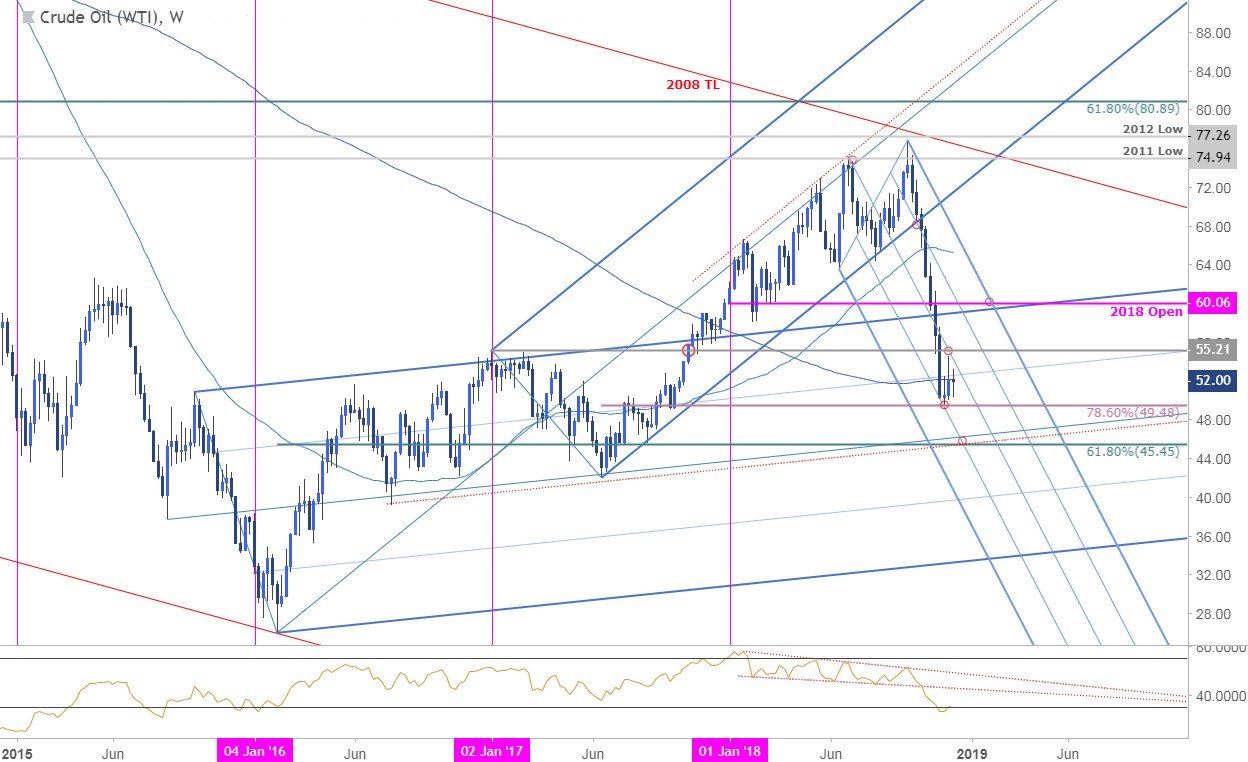
Crude Oil Weekly Price Chart (WTI)
Data Source: TradingView. Prepared by Michael Boutros
Crude oil plummeted through multi-year uptrend support in October with prices down more than 35% off the highs heading into the close of the year. The risk remains for a deeper drawdown here but we’re looking for possible exhaustion heading into key confluence support at 45- this region is defined by the 61.8% retracement of the entire 2016 advance and converges on the median-line of the 2015 / 2016 ascending pitchfork formation into the start of the year. IF prices are going to stabilize, that would be the level to look for. Key resistance stands at the 2018 yearly open at 60.06 and a breach above this region is needed to alleviate further downside pressure in WTI. Bottom line: look for price exhaustion in the first half of 2018 at / ahead of the 45-handle.
To see all the of the analysts Top Trade Ideas for 2019 and Top Lessons from 2018, download the guides on the DailyFX Trading Guides Page.


