


Brent Oil Trying to Stabilize:
- Brent crude trying to recover but longer-term bears remain in control.
- Fears of a global economic downturn continue to weigh.
Q4 Trading Forecasts including Oil.
How to Trade Oil – Crude Oil Trading Strategies
Crude Oil Slide Slowed, Market May be Oversold in the Short-Term
After slumping nearly 9% in the first two trading sessions of the week, Brent has made a small bounce-back after one technical indicator signaled the market touching oversold territory. Tuesday’s low print of $55.88/bbl. saw buyers come back into the market and gives some credence to market talk that a $55/bbl. - $65/bbl. range for oil may be respected in the short-term after the OPEC+ meeting earlier this month cut global oil production by 1.2 million barrels a day. The price of Brent has been driven lower by record US shale production, dampening the oil market as a space, while fears of an economic slowdown in China, the US and Europe has also weakened the market backdrop.
WTI vs Brent – Top 5 Differences Between WTI and Brent Crude Oil
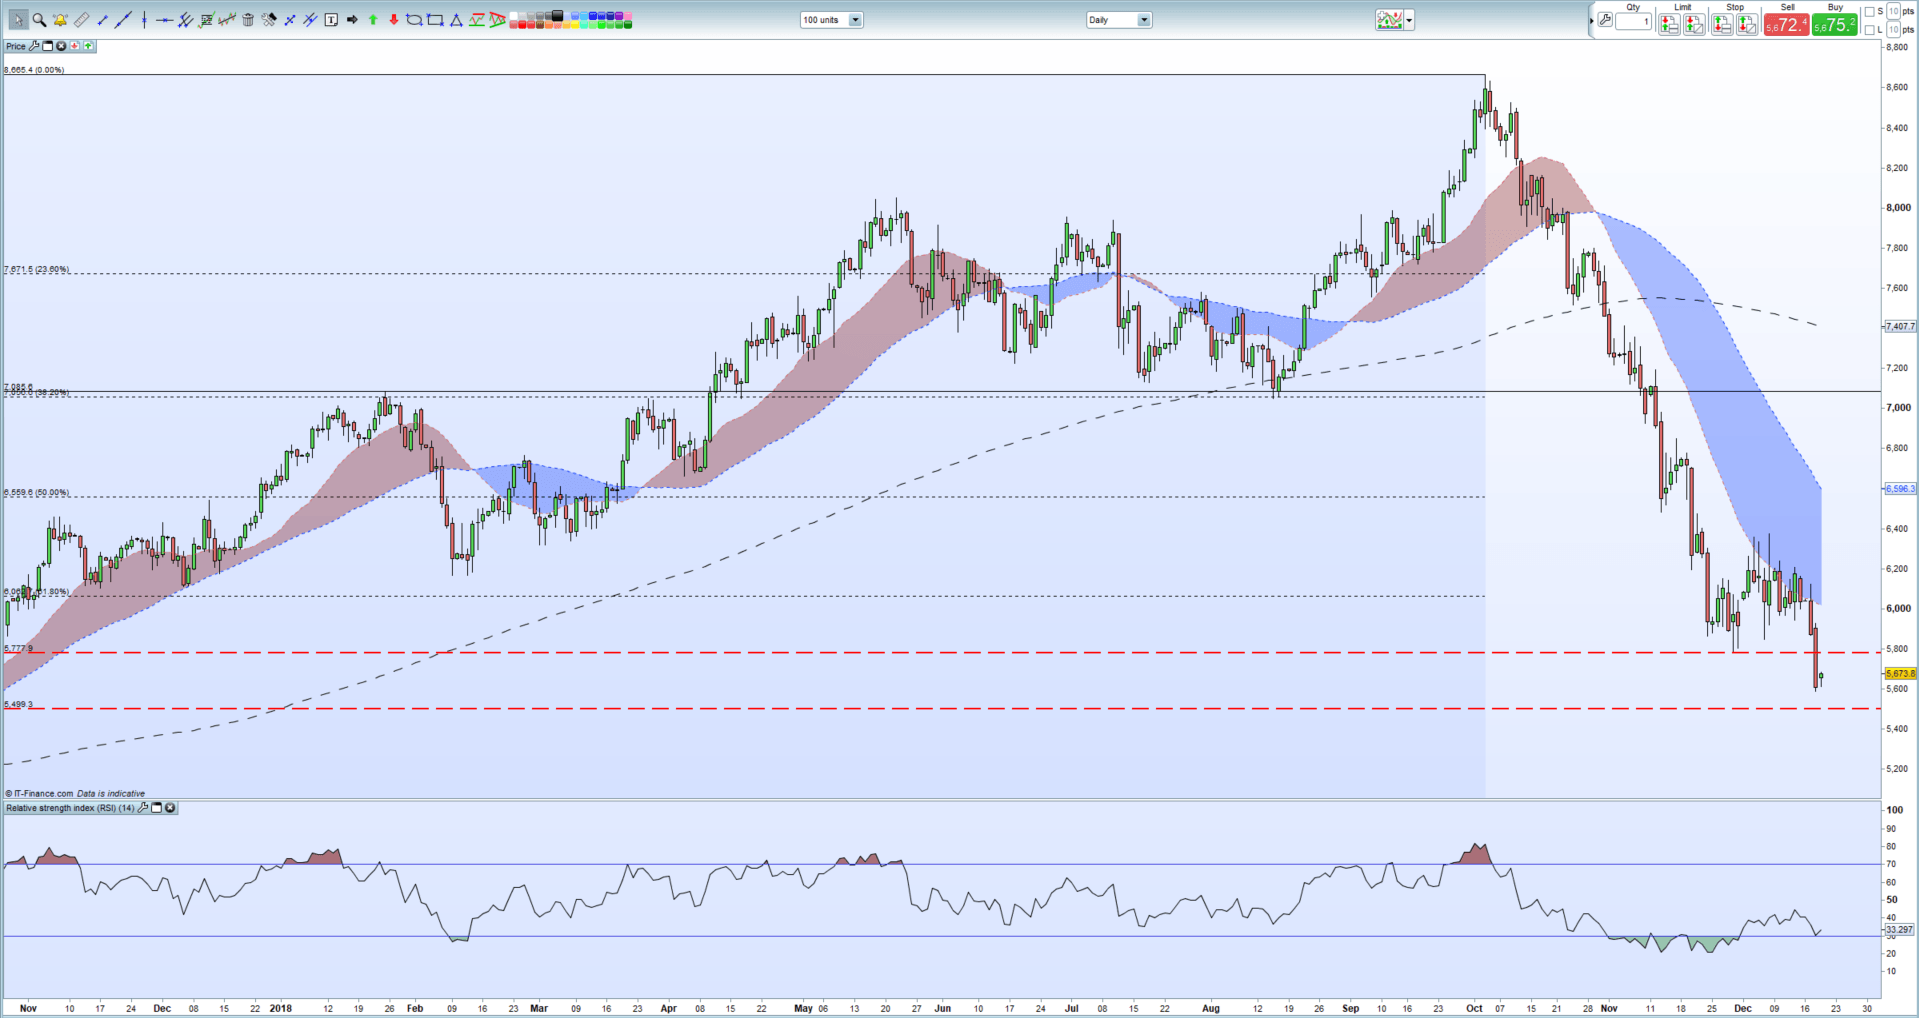
The Brent crude chart remains negative, despite the short-term oversold condition - see the RSI indicator at the bottom of the chart - and needs to break and close above the December 7 high at $63.76/bbl. to break a series of lower highs. Above here the 50% retracement of the June 2017 – October 2018 rally at $65.59/bbl. comes into play although this will need a substantial change in market conditions to be reached. On the downside $54.99/bbl. remains within touching distance ahead of the psychological level at $50.00/bbl.
Brent Crude Oil Daily Price Chart (November 2017 – December 19, 2018)
Retail traders are 88.0%net-long US Crude Oil according to the latest IC Client Sentiment Data, a bearish contrarian indicator. However, recent changes in daily and weekly positions currently give us a mixed trading bias.
Traders may be interested in two of our trading guides – Traits of Successful Traders and Top Trading Lessons – while technical analysts are likely to be interested in our latest Elliott Wave Guide.
What is your view on Oil – bullish or bearish?? You can let us know via the form at the end of this piece or you can contact the author at nicholas.cawley@ig.com or via Twitter @nickcawley1.


