


Bitcoin (BTC) Price, Chart and Analysis
- Higher low pattern starting to show.
- Oversold in the short-term but long-term struggles may continue.
If you are interested in trading Bitcoin, Bitcoin Cash, Ethereum or other cryptocurrencies, we can help you begin your journey with our Introduction to Bitcoin Trading Guide.
Bitcoin’s Reprieve May be Short-Lived
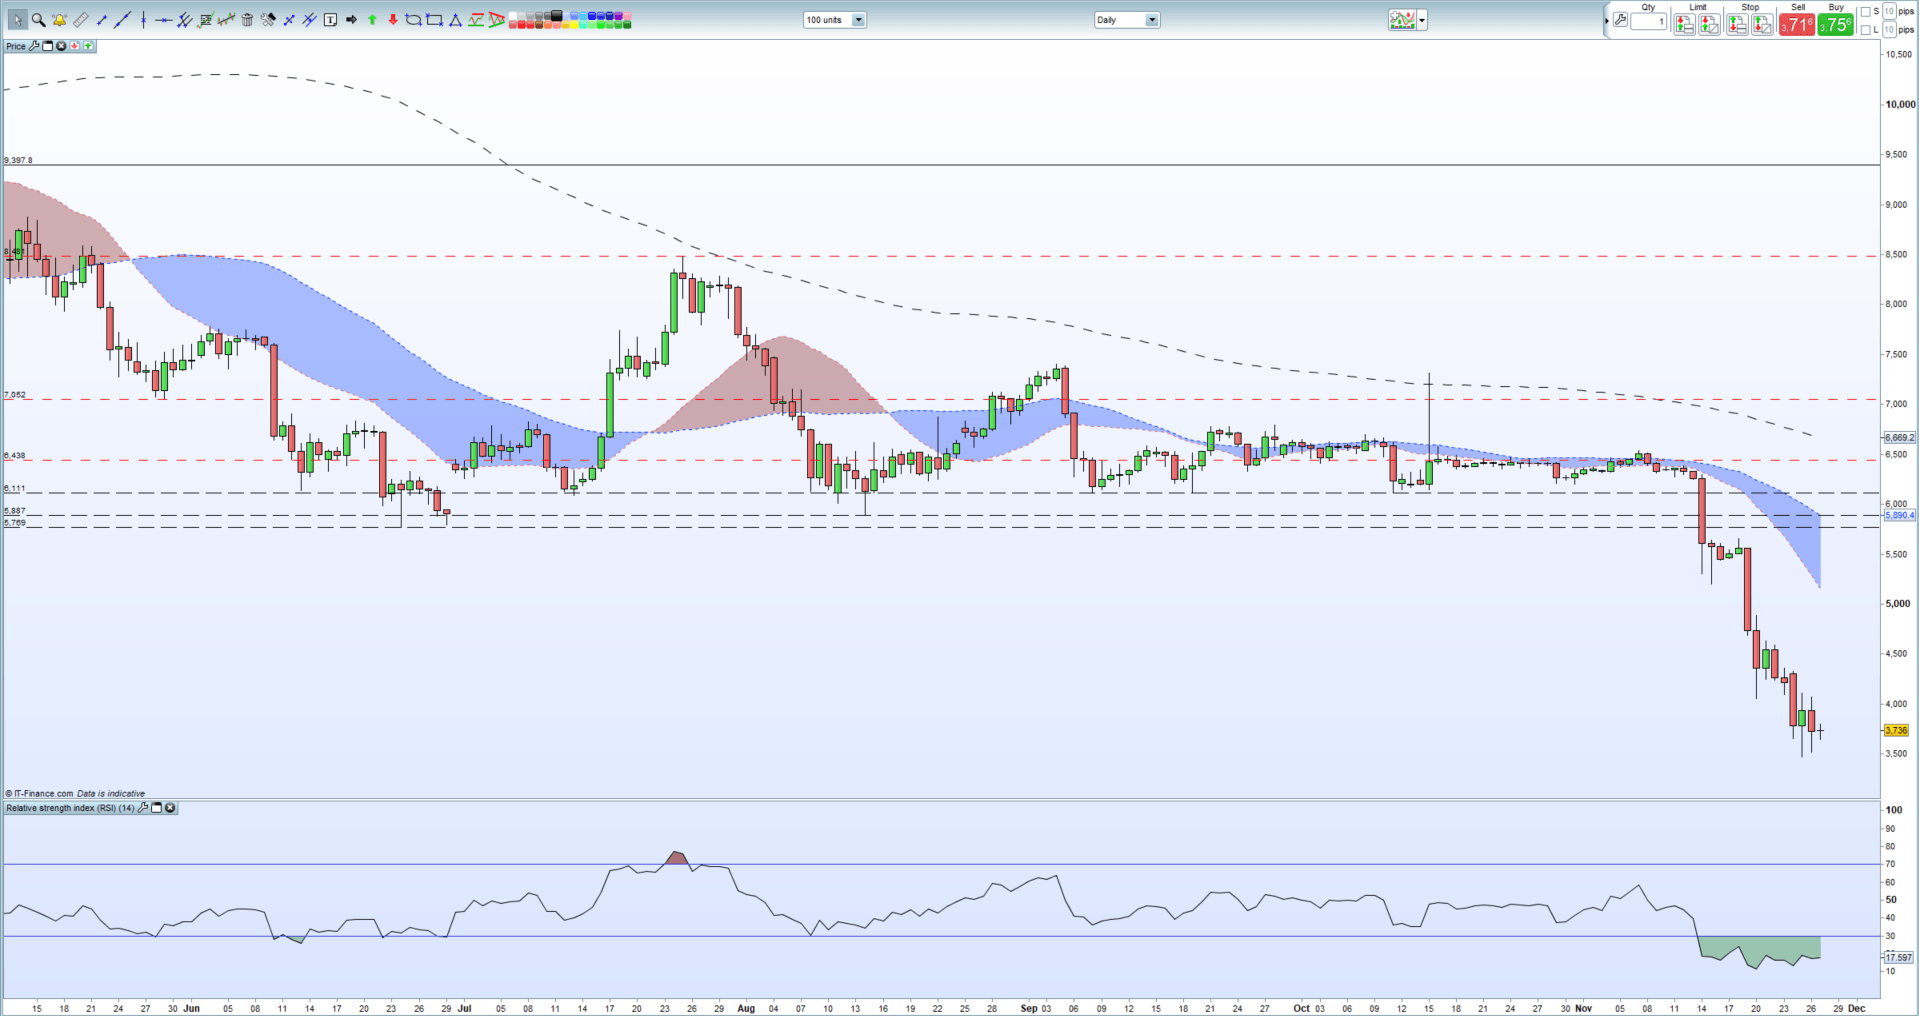
After dropping in excess of 40% in the last two weeks, with very little news to drive the move, Bitcoin is trying to build a base around the $3,500 - $3,700 level in the last three days. While the longer-term chart set-up remains negative - with a test of $2,970 likely - in the short-term the charts are showing the crypotcurrency heavily in oversold territory – RSI indicator at the bottom of the chart - which may produce a relief bounce higher. The last three daily candles are showing higher lows, a positive for Bitcoin bulls, and need to be built upon if prices are to sustain any move higher.
Longer-term Bitcoin remains negative, with the September 2017 low at $2,970 the current target. If this level is broken decisively, the July 2017 swing-low at $1,790 becomes the next level of support.
Bitcoin (BTC) Daily Price Chart (May – November 27, 2018)
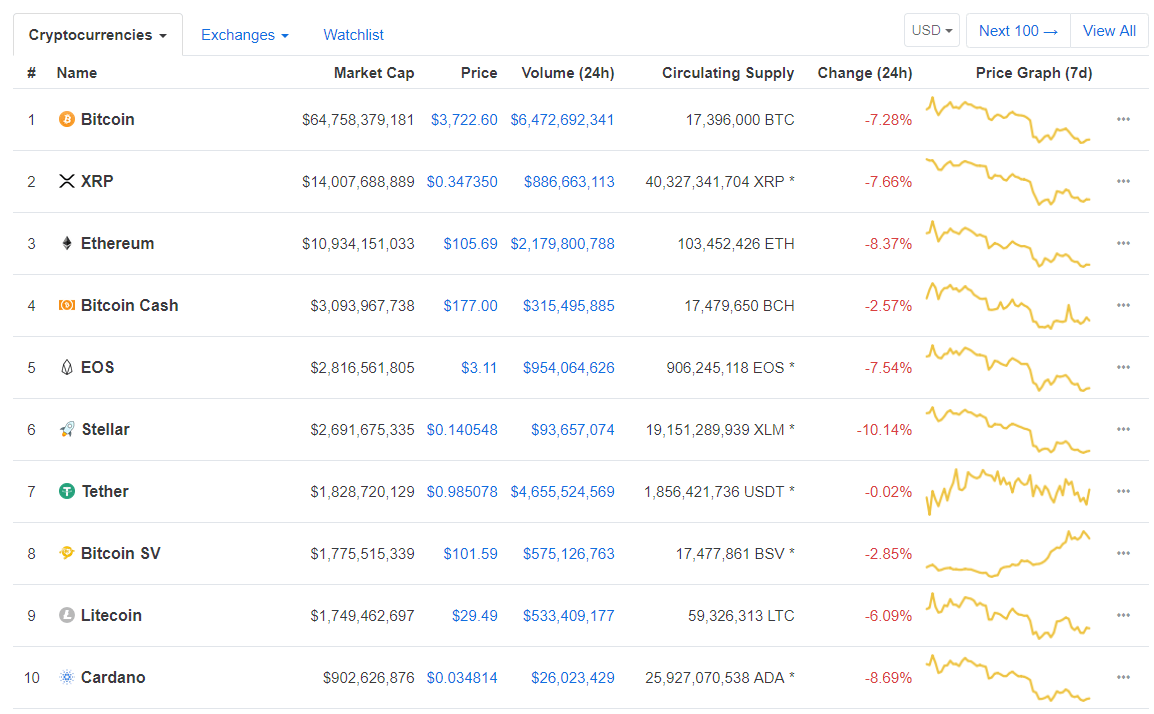
The cryptocurrency marketplace is currently worth just over $121 billion with most coins in negative territory over the last 24 hours. The market hit a peak valuation of $830 billion in January this year.
IG Sentiment Indicator shows that retail investors are 71.8% net-long Bitcoin, a bearish contrarian indicator. However recent changes in daily and weekly positioning, suggest that Bitcoin may soon move higher.
What’s your view on Bitcoin – Bullish or Bearish? Share your thoughts and ideas with us using the comments section at the end of the article or you can contact me on Twitter @nickcawley1 or via email at nicholas.cawley@ig.com.
--- Written by Nick Cawley, Analyst.


