Equity Analysis and News
| Price | 200DMA | RSI | IG Sentiment | |
|---|---|---|---|---|
| Europe | ||||
| FTSE 100 | 6955 | 7400 | 59 | Mixed |
| DAX | 11166 | 12300 | 57 | Mixed |
| CAC 40 | 4945 | 5331 | 57 | Mixed |
| FTSE MIB | 18721 | 21620 | 55 | - |
| US | ||||
| S&P 500 | 2649 | 2762 | 39 | Bearish |
| DJIA | 24446 | 25099 | 37 | Bearish |
| Nasdaq 100 | 6544 | 7139 | 34 | - |
| Asia | ||||
| Nikkei 225 | 21553 | 22489 | 43 | - |
| Shanghai Composite | 2579 | 2943 | 37 | - |
| ASX 200 | 5716 | 6046 | 40 | - |
As of 1245GMT Nov 23rd
.
FTSE 100 | EU Summit to Set the Tone
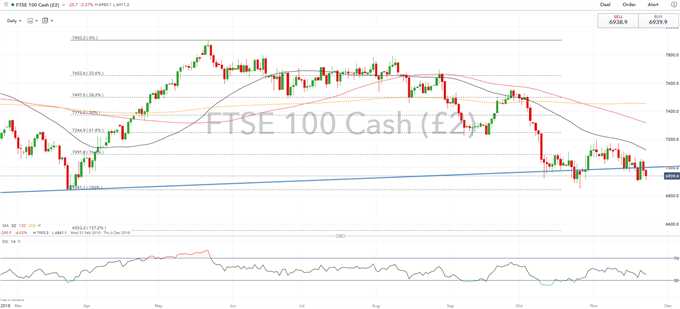
Another volatile week for UK asset classes given the continued uncertainty over Brexit. Looking ahead, the EU summit should set the tone at the beginning of next week. The UK PM and remaining 27 EU countries will look to rubber stamp the withdrawal agreement and political declaration on future ties. However, the big challenge for Theresa May is convincing her divided government to back the deal. Uncertainty will persist with the FTSE 100 unlikely to establish any firm direction. On a sector basis, energy firms continue to feel the brunt from the large declines observed in oil prices, whereby Brent has dropped some 30% since the October 3rd peak.
FTSE 100 Price Chart: Daily Time Frame (Feb – Nov 2018)

Nasdaq 100 | Largest Tech Outflow Since February 2015
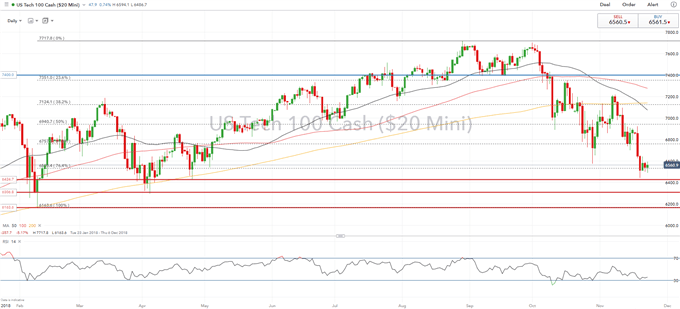
The Nasdaq has moved firmly into correction territory, dropping over 15% from the August peak. Fund flows have shown the largest tech outflows ($1.5bln) since February 2015, while flows have instead rotated into the defensive sector ($8bln). Eyes over the next week will be on a slew of Fed speak (Powell, Clarida), alongside the FOMC’s meeting minutes.
Recent Fed Commentary
A flurry of cautious statements from key Fed Official caught many by surprise. Fed’s Powell and Clarida had both highlighted that US may face headwinds next year with signs of a slowdown in global growth, while fiscal stimulus effects fade. Now, while this will unlikely impact the December rate hike. Further rate increases going forward have come under question with money markets pricing at rate hikes from the Fed.
Nasdaq 100 Price Chart: Daily Time Frame (Jan – Nov 2018)

RESOURCES FOR FOREX & CFD TRADERS
Whether you are a new or experienced trader, we have several resources available to help you; indicator for tracking trader sentiment, quarterly trading forecasts, analytical and educational webinars held daily, trading guides to help you improve trading performance, and one specifically for those who are new to forex.
--- Written by Justin McQueen, Market Analyst
To contact Justin, email him at Justin.mcqueen@ig.com
Follow Justin on Twitter @JMcQueenFX


