


CAD Analysis and Talking Points
- USDCAD | Tests Key Support
- CADJPY | Extends Bounce Off Rising Trendline
- EURCAD | Trend Remains Bullish Above Pivotal 1.50
See our Q4 FX forecast to learn what will drive the currency throughout the rest of the year.
USDCAD | Tests Key Support
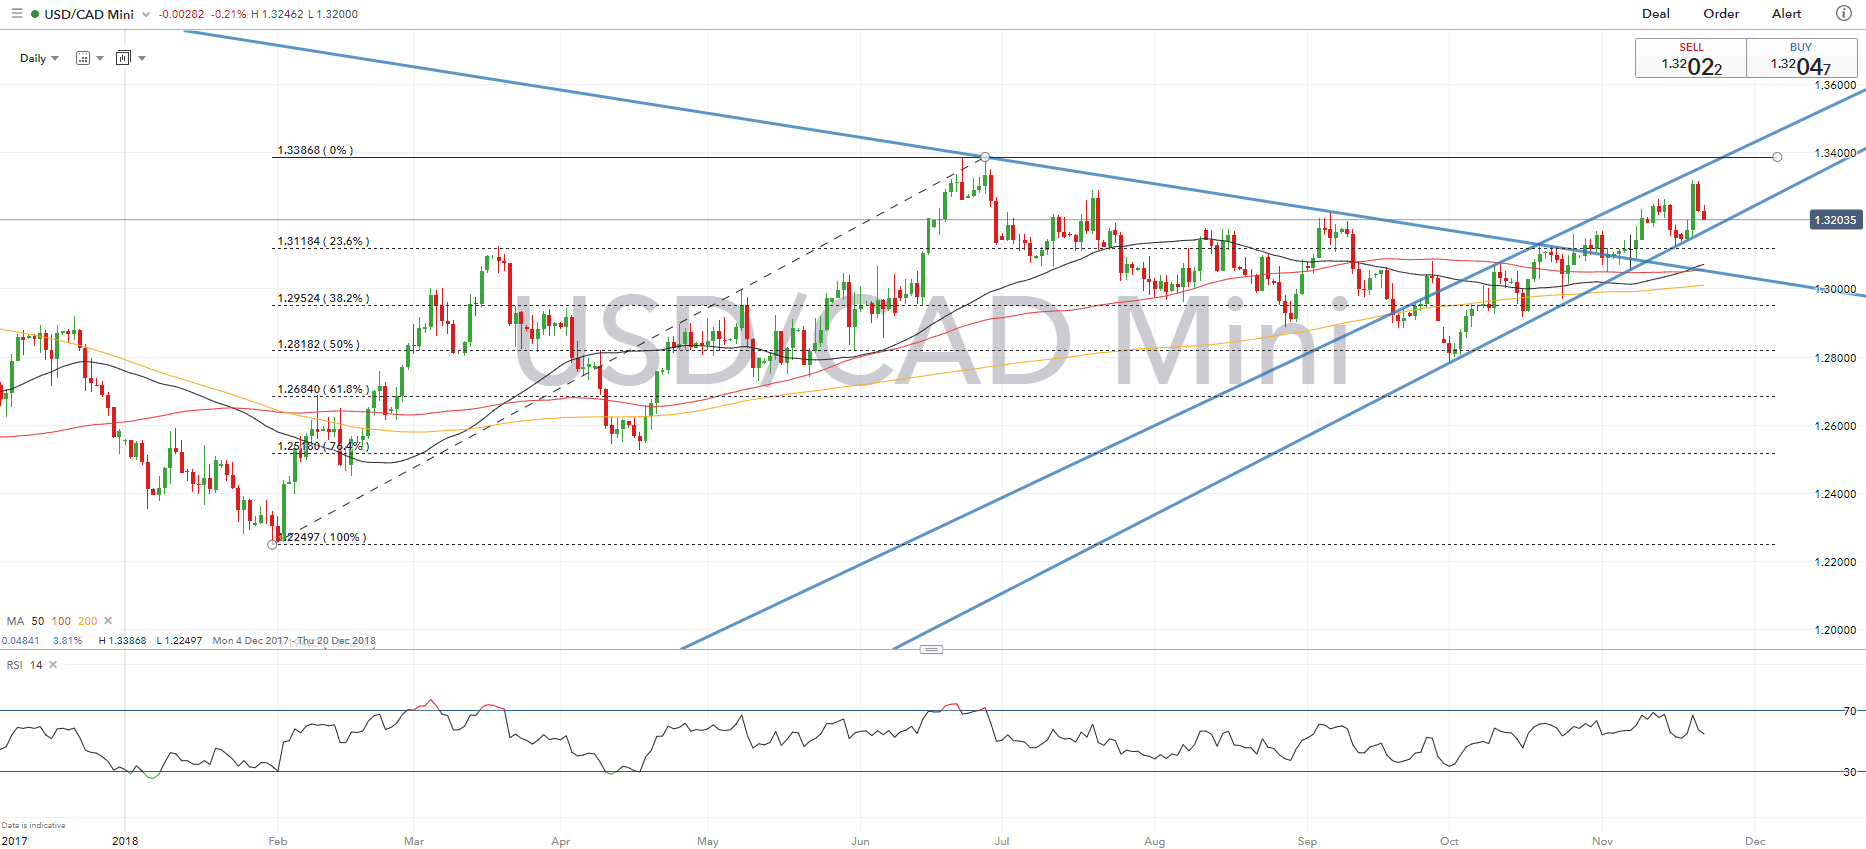
After failing to reach the top of the rising channel, USDCAD is looking at testing the support zone at 1.3180-1.32, while the bearish divergence on the Relative Strength Index suggests that we could see a short-term dip. A break below increases scope for a move towards 1.3115, which marks the 23.6% Fibonacci retracement of the 1.2249-1.3386 rise. However, momentum indicators suggest that the bias remains tilted towards further upside albeit this has moderated in recent sessions. On the upside, little is seen in the way of notable resistance before the 1.34 handle.
USDCAD PRICE CHART: Daily Time Frame (Dec 2017 – Nov 2018)
CADJPY | Extends Bounce Off Rising Trendline
CADJPY has continued to extend on gains after respecting the rising trendline from the March and June lows. The rise was further exacerbated by the breach above the 200DMA (85.30). Although gains may be capped with topside resistance situated at the 86.00 handle, while 86.07 represents that 50% Fibonacci retracement of the drop from 91.58-80.561.
CADJPY PRICE CHART: Daily Time Frame (Dec 2017– Nov 2018)

EURCAD | Trend Remains Bullish Above Pivotal 1.50
A slight pullback observed in EURCAD, however, selling has been curbed at the 100DMA (1.5050). While the trend remains modestly bullish above the pivotal 1.50 handle. As such, eyes remain on the 1.52 handle, whereby a break above opens up a move towards the descending trendline at 1.5250. Momentum indicators confirm further upside is on the horizon, although this has moderated.
EURCAD PRICE CHART: Daily Time Frame (Mar– Nov 2018)

--- Written by Justin McQueen, Market Analyst
To contact Justin, email him at Justin.mcqueen@ig.com
Follow Justin on Twitter @JMcQueenFX


