Gold Price, News and Analysis
- Gold finds no hiding place from sellers.
- Retail investors remain heavily long of the precious metal.
The brand new DailyFX Q4 Gold Forecast is now available to help traders navigate the market.
Are you new to gold trading or are you looking to improve your trading skill sets? We have recently produced an in-depth primer on How to Trade Gold: Top Gold Trading Strategies and Tips.
Gold Remains Weak with a Break Back Below $1,200/oz Looking Likely.
Gold has lost around $30/oz. in less than one week as the US dollar charge continues. Last week’s FOMC meeting confirmed that US interest rates will continue to climb this year and next, while the Democrats’ victory in the House of Representatives is being taken as a USD positive so far, as it makes US President Trump more accountable for his actions. The precious metal was also unable to pick up a risk-off bid after US and Asian stock markets crumbled overnight on tech - mainly due to Apple - and worries that US-China trade wars may escalate.
Asian stocks wilt under Wall Street pressure, USD holds up.
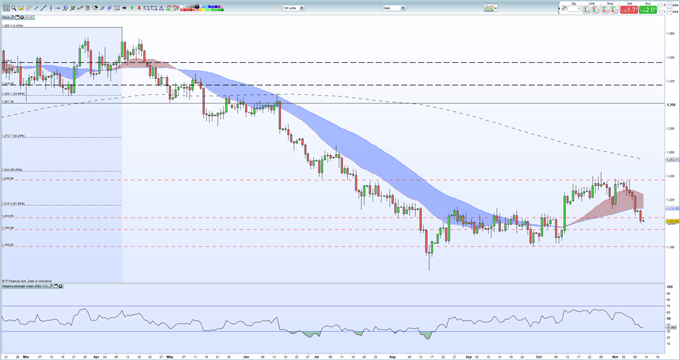
The strength of the US dollar, and the weakness of the offshore Chinese Yuan, continues to weigh on gold which now looks likely to make a fresh one-month low below $1,200/oz. The next level of reasonable support does not cut across until $1.180/0z. – the September 28 low print – before the August 16 low of $1,160/0z. comes into play. On the upside, congestion between the 50-day moving average at $1,212/oz. and the 61.8% Fibonacci retracement at $1,214.9/0z. should cap any rally.
Gold Daily Price Chart (February - November 13, 2018)

Gold Positioning: Retail Remain Long
IG Retail Sentiment shows 85.3% of traders are net-long gold, a bearish contrarian indicator. However, the combination of current sentiment and recent changes gives us a mixed Spot Gold trading bias.
We are interested in your opinion and trading strategies for Gold. You canshare your thoughts, views or analysis with us using the comments section at the end of the article or you can contact the author via email at nicholas.cawley@ig.com or via Twitter @nickcawley1.
--- Written by Nick Cawley, Analyst


