Oil Price Analysis and News
- Saudi Arabia Hints at Oil Production Boost
- Equity Market Rout Raises Demand Growth Concerns
- Brent Follows WTI to Fall into Contango
Saudi Arabia Hints at Oil Production Boost
Saudi Arabia added to the negative sentiment for crude oil futures after the OPEC member suggested that they would boost oil supply. The Saudi Energy Minister attempted to alleviate concerns over a potential supply shock from Iranian sanctions set to be imposed next month through implying a 1-2mbpd increase in oil production from current levels (10.5mbpd).
Equity Market Rout Raises Demand Growth Concerns
Global growth prospects have continued to deteriorate amid the recent sell-off in equity markets, which have largely stemmed from the weakness in Asia. In particular, the South Korean KOSPI index, which is typically seen as a barometer for global trade growth given the country’s large export orientation, is on the brink of a bear market having dropped 19.5% from the 2018 peak. Consequently, the risk off sentiment has largely played a part in the drop for oil prices with concerns over demand growth increasing.
US API Build, Eyes on DoE
The latest API crude oil inventory report showed a sizeable build of 9.9mln barrels above the expectations of 3.7mln barrels, which in turn increases the risk that US crude stocks may have risen for a 5th consecutive week. As such, another build in the DoE report may place further pressure on the energy complex, alongside this, eyes will be on the US crude production
Brent Follows WTI to Fall into Contango
Last week it had been highlighted that a bearish development had occurred with WTI slipping into contango, whereby the spot price is lower than the forward contract, which in turn leads to a negative roll yield and a possible increase in speculative bearish bets. Brent crude futures have now followed WTI following yesterday’s plunge which sees the Brent curve now in contango of -$0.03.
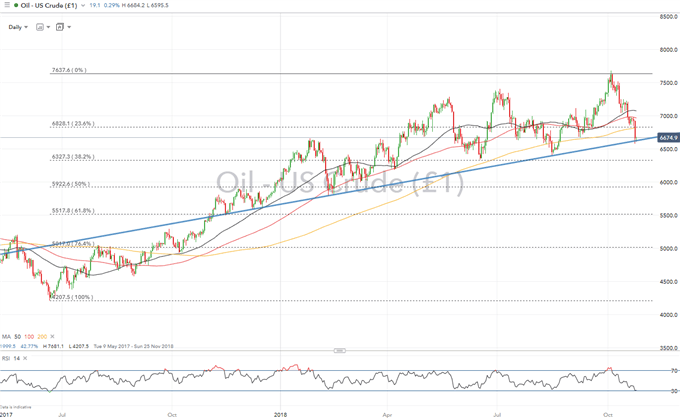
Oil Price Chart: Daily Time Frame (March-October 2018)

WTI crude is testing the ascending trendline stemming from November 2017. A break increases scope of a move towards the 38.2% Fibonacci retracement situated at $63.27. Elsewhere, the 200DMA represents resistance on the topside, which also coincides with the 23.6% Fibonacci Retracement.
--- Written by Justin McQueen, Market Analyst
To contact Justin, email him at Justin.mcqueen@ig.com
Follow Justin on Twitter @JMcQueenFX


