


Talking Points:
- The Treasury offered $45 billion in 3-month and $39 billion in 6-month bills.
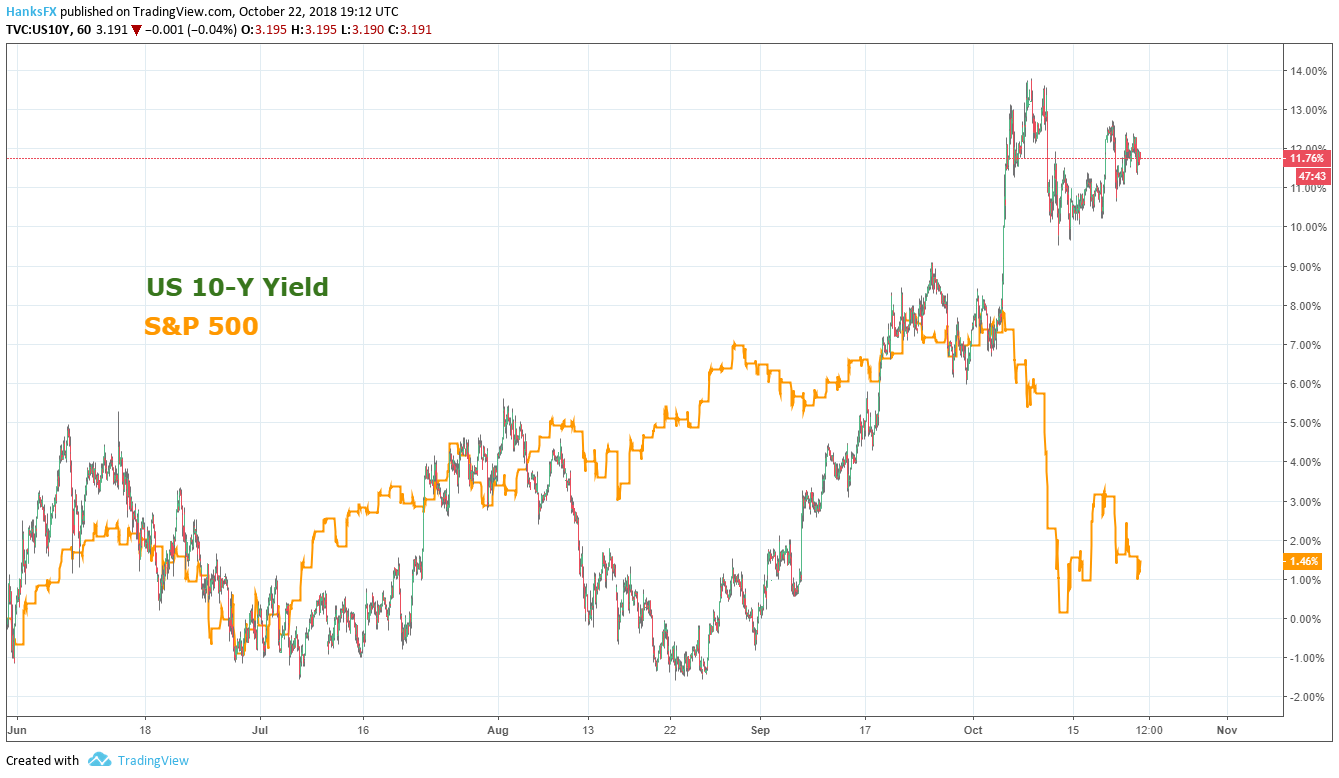
- Since June, the benchmark 10-year bond yield has climbed a little over 11%.
- Rising rates have been a source of concern for investors in October, spooking equity markets.
The US Treasury auctioned a series of short-term bills Monday, which could potentially attract capital from other low-risk investments as US bond yields climb. The auction of $45 billion in 3-month bills fetched a rate of 2.346% while the 6-month bills offered 2.489%. Since June, the benchmark 10-year yield has staged a rather robust climb from 2.859% to Mondays 3.195%. Given the consistent flow of US Treasury bills onto the market, it is not anomalous but investors have begun to express concern.
How to Trade S&P 500 Index: Strategies, Tips & Trading Hours
In the first week of October alone, the 10-year yield jumped from 3.065% to 3.242%. The dramatic uptick was one of the contributing factors investors highlighted in the recent equity rout. The rout saw the S&P 500 surrender over 150 points in two days.
US 10-Year Treasury Bond Yield vs S&P 500 Price Chart: Daily Timeframe (June to October 2018) (Chart 1)
While rising yields may have weighed on equity markets, the US Dollar continues to show considerable strength with the Dollar basket testing 96.00. The Treasury auction will only work to bolster the Dollar’s position, reducing the immediate supply of capital in the global market.
DXY Index Price Chart: Hourly Timeframe (October 2018) (Chart 2)

On the larger scale however, even an auction worth $84 billion will do little to heavily impact the Dollar’s price versus other major counterparts. Thus, the greenback sourced its strength from other factors on Monday like the precipitous drop in GBP/USD after a no confidence vote risk. Later in the week, the Dollar will look to US GDP data due Friday for influence.
Read more: FX Week Ahead: BOC on Wednesday, ECB on Thursday, Q4’18 US GDP on Friday
DailyFX forecasts on a variety of currencies such as the US Dollar or the Euro are available from the DailyFX Trading Guides page. If you’re looking to improve your trading approach, check out Traits of Successful Traders. And if you’re looking for an introductory primer to the Forex market, check out our New to FX Guide.
--- Written by Peter Hanks, Junior Analyst for DailyFX.com
Contact and follow Peter on Twitter @PeterHanksFX


