


Gold Prices, News and Analysis
- Risk-off rally has dissipated, and gold looks increasingly vulnerable.
- Battle between retail investors and speculators continues.
The brand new DailyFX Q4 Gold Forecast is now available to help traders navigate the market.
Are you new to gold trading or are you looking to improve your trading skill sets? We have recently produced an in-depth primer on How to Trade Gold: Top Gold Trading Strategies and Tips.
Gold Price Nears Important Support
The recent risk-off inspired rally in the precious metal has abated for now, leaving gold looking toppy near its recent multi-month high. The sharp sell-off in the equity (risk) space was triggered by concerns over higher US interest, and bond, rates, a view that proved prescient after Wednesday’s hawkish FOMC minutes. The hawkish tone from the Fed’s Powell firmed expectations of at least three rate hikes in 2019, with a December 2018 rise now fully baked in. And with the Fed looking to get ahead of any inflation uptick, market expectations are starting to grow for a fourth-rate hike in 2019 which would see the Fed Funds rate rise to 3.25% to 3.5% from a current level of 2.0% to 2.25%. Gold may find sharply higher short-term US Treasury yields difficult to fight against.
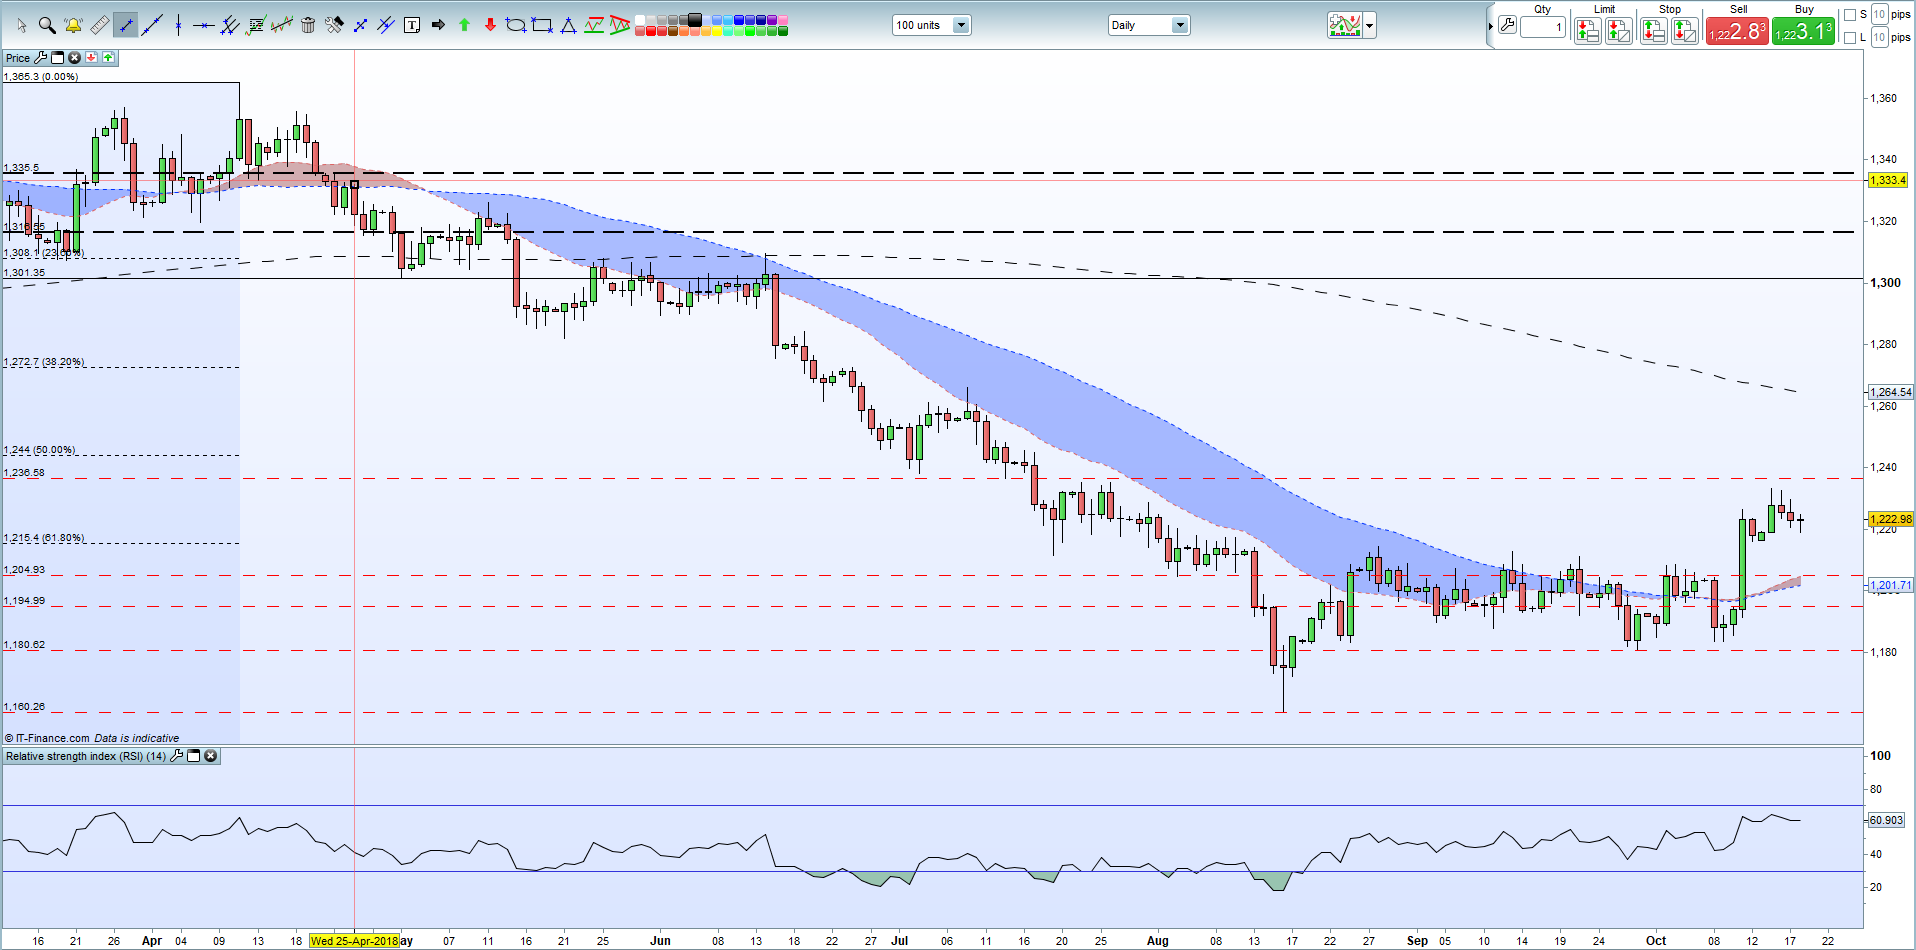
The daily gold chart points to an important technical support level – the 61.8% Fibonacci retracement of the December 2016/April 2018 rally – at $1,215.6/oz. This level also coincides with two recent lows on October 12 and 14 that underpinned the push to the recent $1,233/oz. high print.
Gold Daily Price Chart (March – October 18, 2018)
Gold Positioning: Speculators Heavily Short, Retail Long
Retail investors remain long of gold (81.3%), according to the latest IG Client Sentiment Report, usually seen as a bearish contrarian set-up. Recent changes have shifted the retail bias to bullish for gold positing however the current long-to-short ratio of 4.34 to 1 should not be ignored. Speculative traders are net-short of gold and the recent CoT report showed those shorts growing over the last week. The battle between the two continues.
Weekly CoT Update: Speculative Selling in Gold Proving Untimely.
We are interested in your opinion and trading strategies for Gold. You canshare your thoughts, views or analysis with us using the comments section at the end of the article or you can contact the author via email at nicholas.cawley@ig.com or via Twitter @nickcawley1.
--- Written by Nick Cawley, Analyst


