


TALKING POINTS – AUD/USD, RBA, CHINESE CPI, EQUITIES
- AUD/USD rose after mostly as-expected Chinese inflation statistics
- Dominant downtrend remains intact, December 2016 support levels eyed
- Sour market mood and interest rate differentials may extend declines
Build confidence in your own AUD/USD strategy with the help of our free guide!
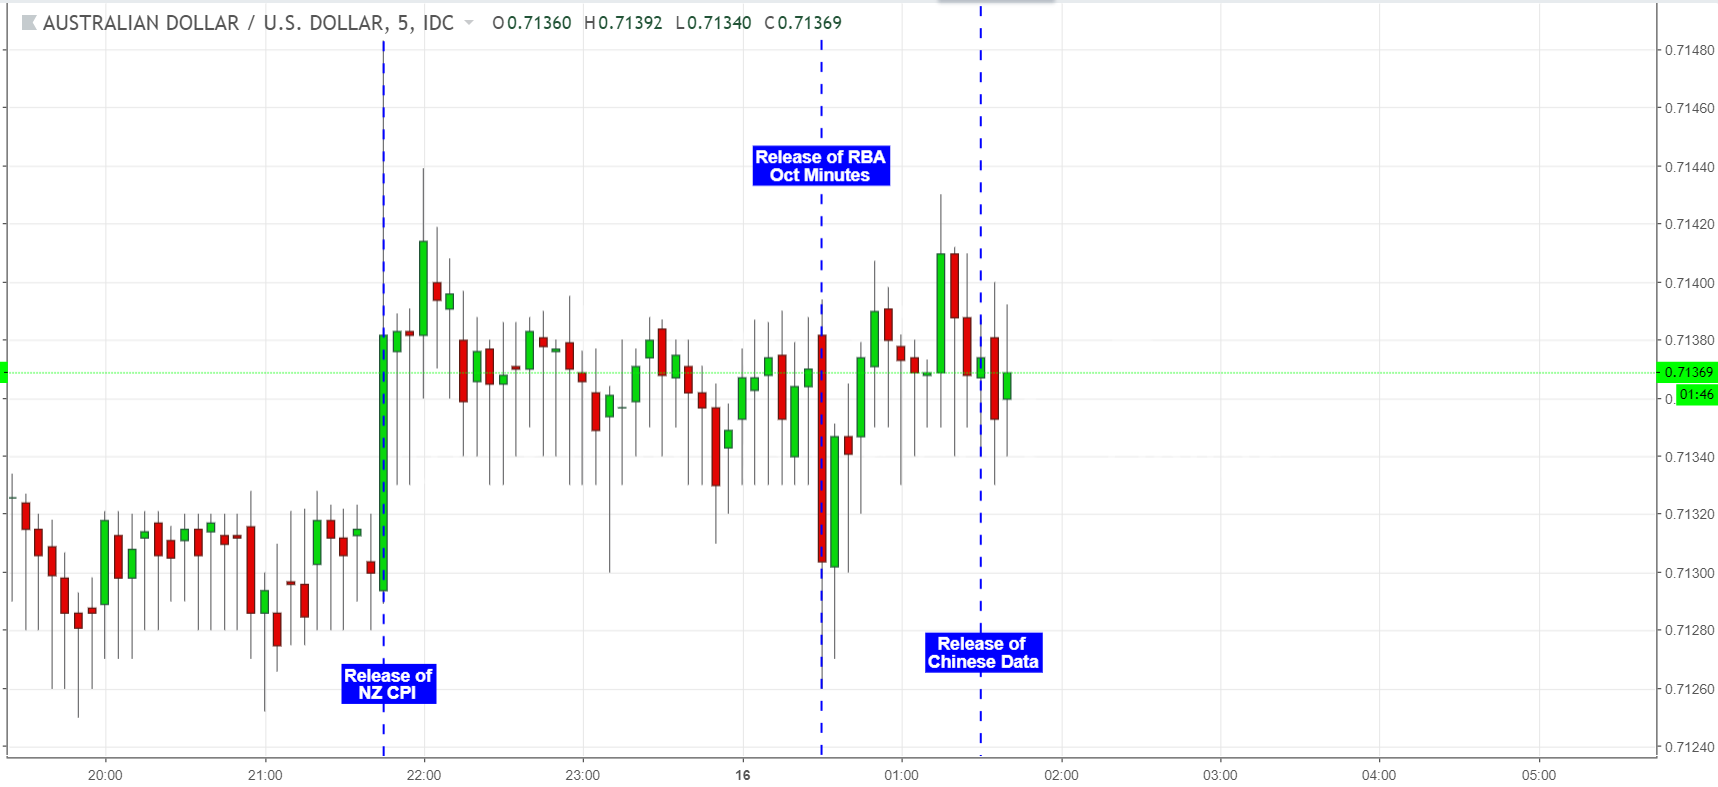
The Australian Dollar gained against its US counterpart as economic data from its major trading partner China crossed the wires during Tuesday’s Asia Pacific trading session. Consumer inflation in September was in line with economists’ forecasts of 2.5%, an increase from the prior 2.3%. Meanwhile, last month’s producer price index clocked in at 3.6%%, vs. estimates of 3.5% and August’s 4.1%. Australian weekly consumer confidence data also was released, increasing to 119.5 from last week’s 117.3.
These slight gains have continued throughout today’s trading session, despite slight bearish action after somewhat dovish minutes from the Reserve Bank of Australia’s October 2nd meeting. The central bank stated that while the next rate movement would likely be an increase, it saw no case for a near-term adjustment in policy. The monetary authority also noted that AUD weaknesses was likely helpful for economic growth.
AUD/USD Chart (5-minute)
The RBA’s dovish stance, combined with haven demand and recent weakening Australian economy activity, have caused AUD/USD to remain in a dominant downtrend. Despite its recent rally, the currency pair set its 2018 low of 0.7085 as recently as September 11 after breaking through key December 2016 support levels near the 0.716-0.719 range. These may serve as resistance for the future if the trend line continues to hold. Invalidation of this descending trend may indicate a bullish reversal.
AUD/USD Chart (Daily)
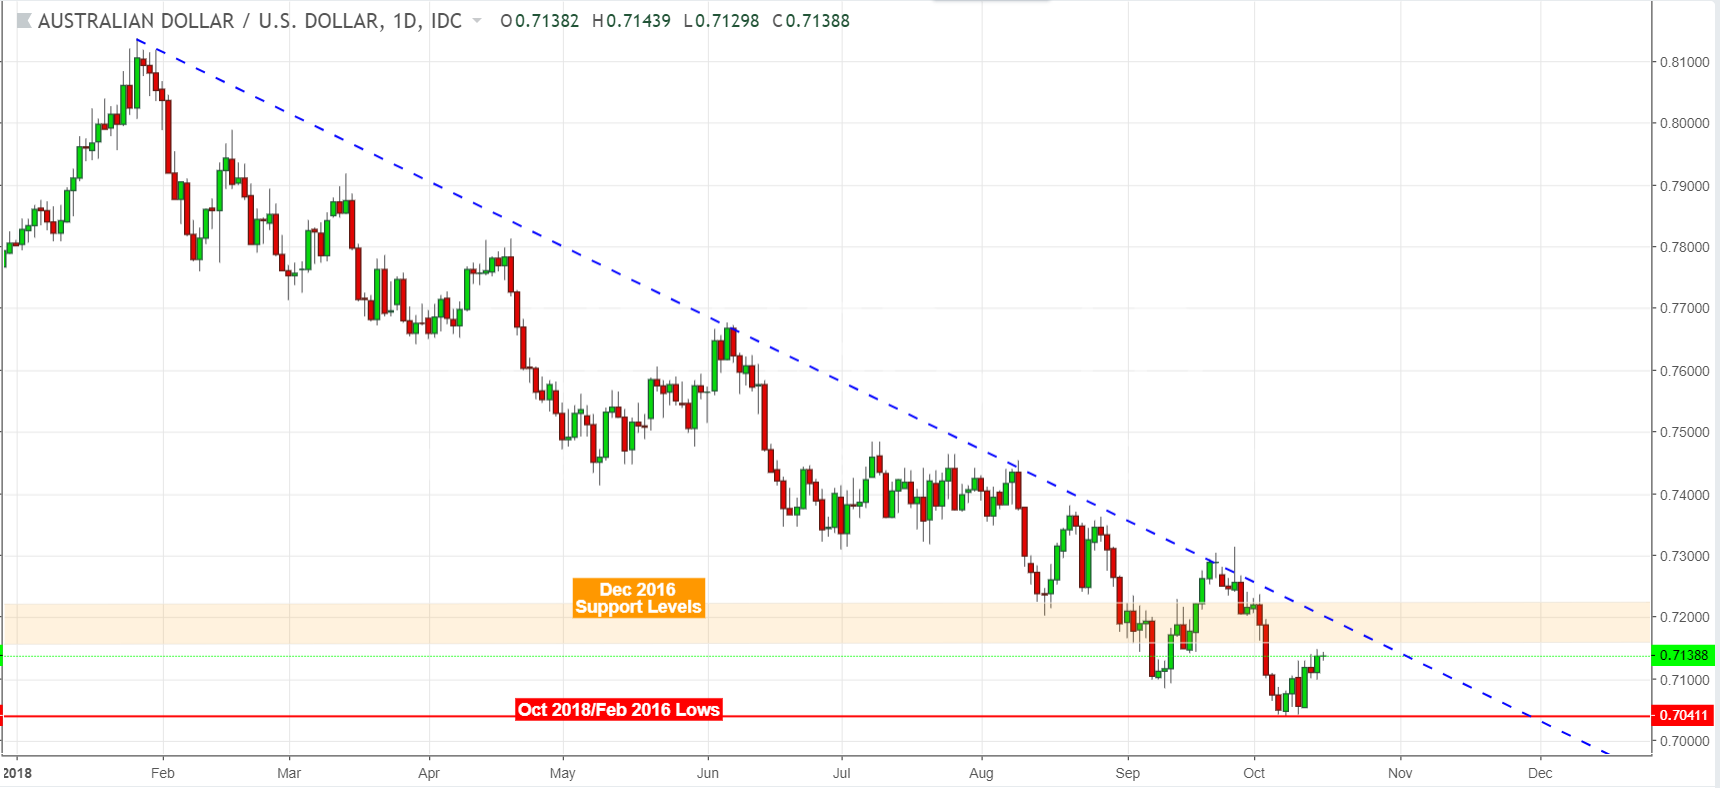
Looking ahead, the Australian Dollar may set new lows for this year as the sentiment-linked unit will closely eye risk trends. The recent bout of risk aversion and global stocks’ selloff could indicate further bearish price action. In addition, AUD/USD will also be closely eyeing September’s Australian employment data and the release of 3Q Chinese GDP later this week.
AUD/USD Trading Resources
- Join a free Q&A webinar and have your trading questions answered
- Just getting started? See our beginners’ guide for FX traders
- Having trouble with your strategy? Here’s the #1 mistake that traders make
- See how the Australian Dollar is viewed by the trading community at the DailyFX Sentiment Page
--- Written by Megha Torpunuri, DailyFX Research Team


