
GBPUSD price, news and analysis:
- Brexit splits among members of the UK Cabinet, alongside a modestly firmer US Dollar, could endanger the past month’s advance in GBPUSD.
- Technically, the pair is now sitting on trendline support; losses are likely if it breaks.
Check out the IG Client Sentiment data to help you trade profitably.
GBPUSD facing possible correction lower
After advancing steadily since the middle of last month, factors are conspiring to undermine the GBPUSD price.
The Times newspaper reported Thursday that UK Prime Minister Theresa May is losing the support of her Cabinet for a no-deal Brexit if the European Union again rejects her “Chequers” proposals for an agreement next month.
In addition, the US Dollar is modestly firmer in the wake of Wednesday’s decision by the Federal Reserve to increase US interest rates by a quarter of a percentage point, as expected. Together, these factors are outweighing any optimism about a possible US-UK trade deal after a meeting between May and US President Donald Trump.
GBPUSD Price Chart, Daily Timeframe (May 30 – September 27, 2018)
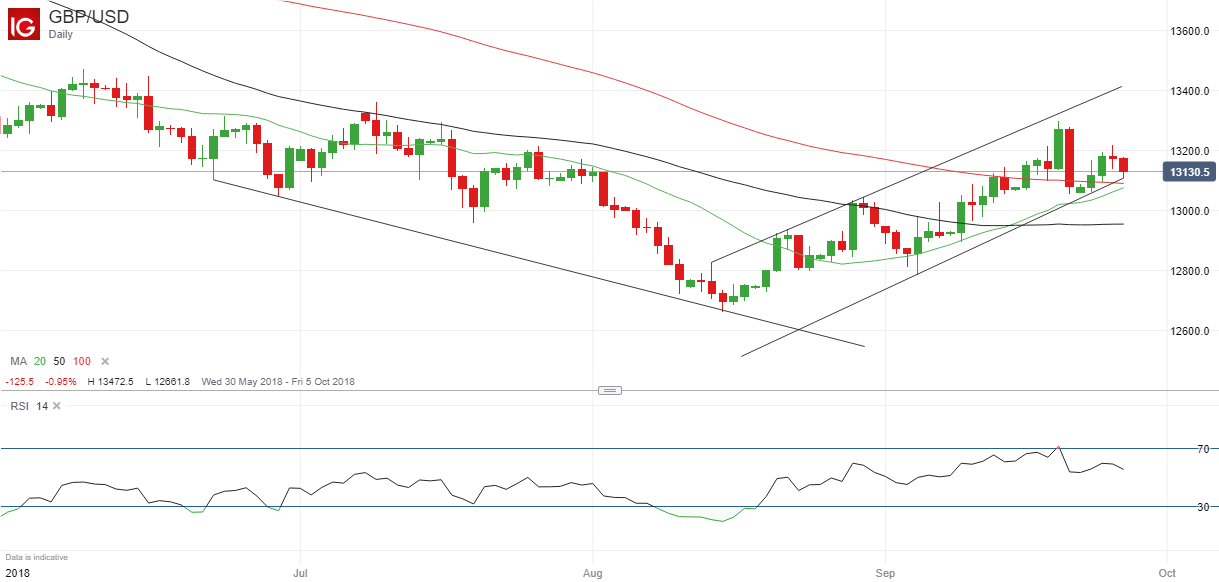
Meanwhile, as the GBPUSD chart above shows, the pair is now sitting on trendline support and any break below it would be a negative technical signal. However, the downside is also protected by the 100-day moving average at 1.3090 and the 20-day moving average at 1.3076 before the September 21-24 lows between 1.3054 and 1.3063 will come into focus.
If, on the other hand, the trendline support holds, a move back towards the middle of the upward sloping channel around 1.33 is possible.
Resources to help you trade the forex markets
Whether you are a new or an experienced trader, at DailyFX we have many resources to help you:
- Analytical and educational webinars hosted several times per day,
- Trading guides to help you improve your trading performance,
- A guide specifically for those who are new to forex,
- And you can learn how to trade like an expert by reading our guide to the Traits of Successful Traders.
--- Written by Martin Essex, Analyst and Editor
Feel free to contact me via the comments section below, via email at martin.essex@ig.com or on Twitter @MartinSEssex