Oil Price, News Analysis and Charts
- Brent crude jumps after OPEC signal that they won’t boost production.
- US sanctions on Iran kick-off on November 4.
The DailyFX Q3 Oil Forecast is available to help traders navigate the market.
Oil Bursts Higher and May Continue to Rally
Oil broke above $81.00/bbl. Tuesday, its highest level in nearly four years, after OPEC and Russia refused to up production ahead of US sanctions on Iran. From November 4 the US will impose sanctions on Iran’s oil exports leaving a supply gap in the market, one which OPEC and Russia seem reluctant to fill. The US sanctions are expected to remove at least 1 million barrels of crude oil from the market per day. This action, and inaction, has seen oil move steadily higher in the last six weeks, rallying from $70/bbl. to its current level at $81/bbl. Unless an agreement is reached to fill this supply gap, and US President Trump is vocal in calling for it to be filled, prices will continue to push higher with little in the way of resistance on the charts.
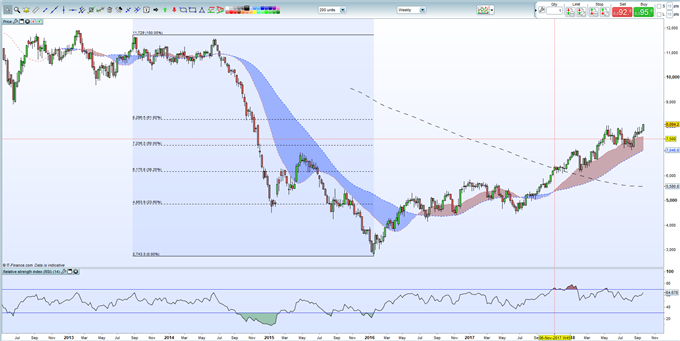
Looking at the weekly chart and there seems to be very little in the way to stop oil from pushing higher. The sharp sell-off from June 2014 to January 2015, when the price fell from $114/bbl. to $47/bbl. has room for oil to move higher without too much technical resistance. The current price also trades above all three moving averages while the RSI is still not in overbought territory and is moving higher. Any sell-off should find support initially at $80/bbl before the 20-day moving average at $78.27/bbl.
Oil Price Weekly Chart (June 2012 - September 25, 2018)

The latest IG Retail Sentiment Indicator shows how traders are positioned in a wide array of financial products.
We are interested in your opinion and trading strategies for oil. You canshare your thoughts, views or analysis with us using the comments section at the end of the article or you can contact the author via email at nicholas.cawley@ig.com or via Twitter @nickcawley1.
--- Written by Nick Cawley, Analyst


