


EURUSD – Price, Chart and Technical Analysis
- Euro continues to battle against the US dollar and one bad NFP print won’t change that.
- US trade wars continue to give the greenback a haven boost.
The latest IG Client Sentiment Indicator shows retail are 46.3% net-long EURUSD, normally a bearish set-up, but recent daily and weekly positional shifts throw up a mixed trading bias.
The DailyFX Q3 forecasts and analysis of USD and EUR are just two of the major currencies available to download here.
EURUSD Risk-Reward Remains Tilted to the Downside
The latest look at the state of the US jobs market – Non-Farm Payrolls at 12:30 GMT –should provide yet more evidence that the US economy remains in robust shape, justifying more interest rate hikes ahead. Consensus is for another 195,000 jobs to have been created, below the 214,000-monthly average, but still enough to push the unemployment rate down to 3.8%, an 18-year low that was touched in May.
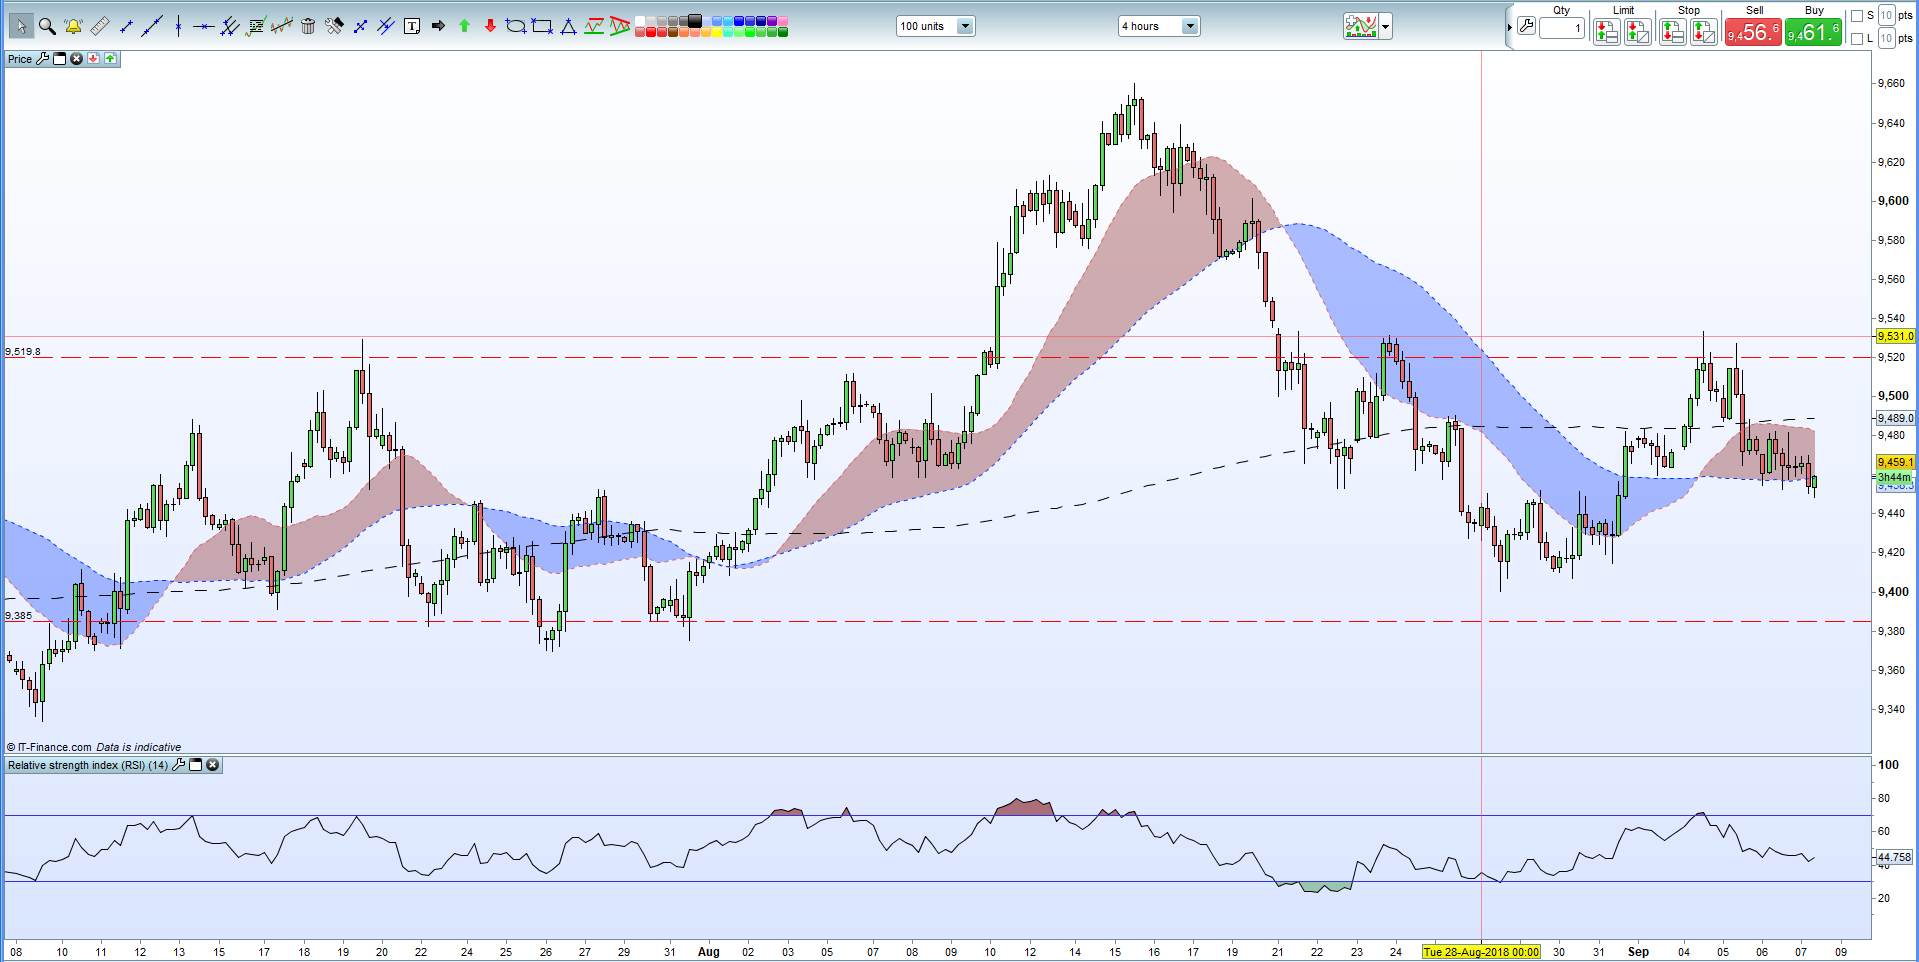
The US dollar basket (DXY) has edged lower in the last four days but remains well supported around 94.00 and should push higher over the coming days. DXY needs to break through the 95.20 - 95.30 zone before it can re-test the August 15 high at 96.60.
US Dollar Basket (DXY) Four Hour Price Chart (July 6 – September 7, 2018)
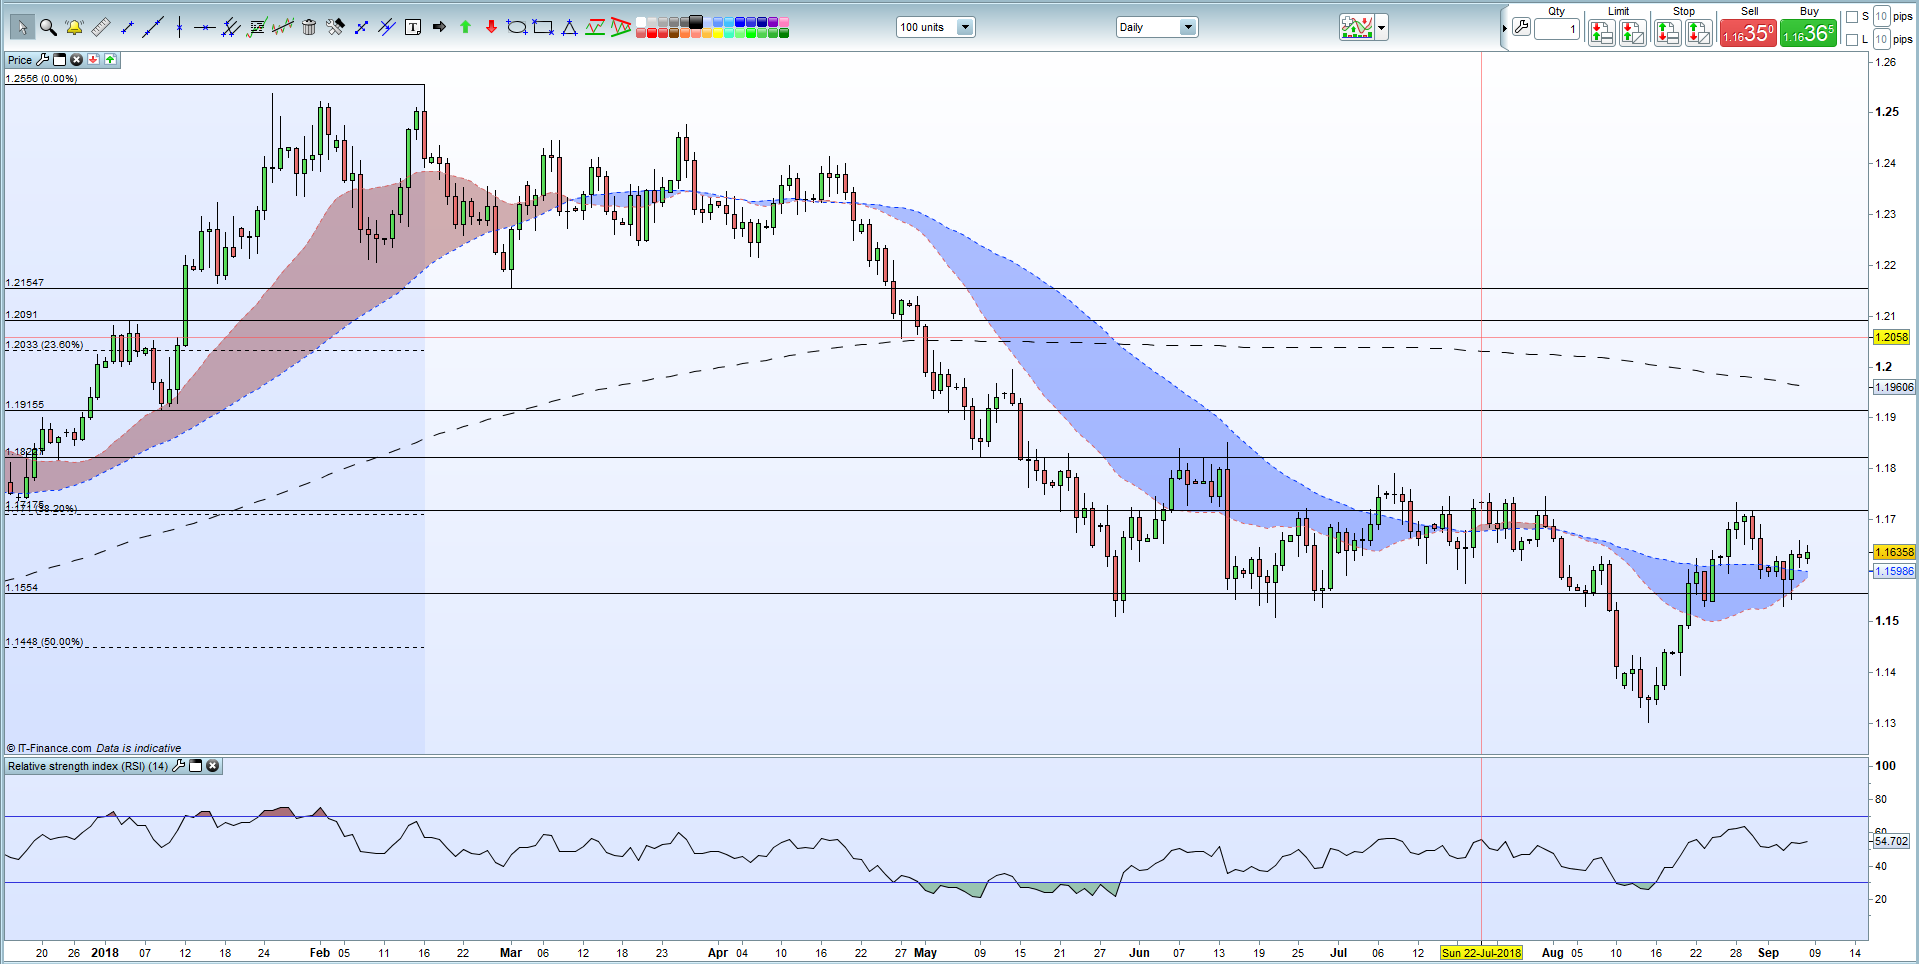
The EURUSD rally off the August 15 low at 1.13010 has petered out and the pair continues to struggle to push higher. Short-term support is being provided by the 20- and 50-day moving averages at 1.15875 and 1.15987 respectively with an old swing-low form November at 1.15540 also adding a layer of support. Moves to the upside should find resistance at 1.16560 before a confluence of highs and Fibonacci retracement between 1.17100 and 1.17500.
EURUSD Daily Price Chart (December 2017 – September 7, 2018)
If you are new to foreign exchange, or if you would like to update your knowledge base, download our New to FX Guide and our Traits of Successful Traders to help you on your journey.
What’s your opinion on the US Dollar? Share your thoughts with us using the comments section at the end of the article or you can contact the author via email at Nicholas.cawley@ig.com or via Twitter @nickcawley1
--- Written by Nick Cawley, Analyst


