


Ripple, Ethereum, Litecoin Prices, News and Technical Analysis
- Steady at lower levels as cryptocurrencies stall.
- Litecoin mildly positive compared to Ethereum and Ripple.
Ripple (XRP), Ethereum (ETH) and Litecoin (LTC) Stuck
The cryptocurrency market remins in a late-summer lull with little price action of note and stagnating prices. Market-leader Bitcoin is attempting to push ahead and continues to rule the market with 53% dominance, but the next tier of cryptos are struggling to move, either way. The market as a whole is back to levels seen one-month ago, using total market capitalization, and volumes remain low.

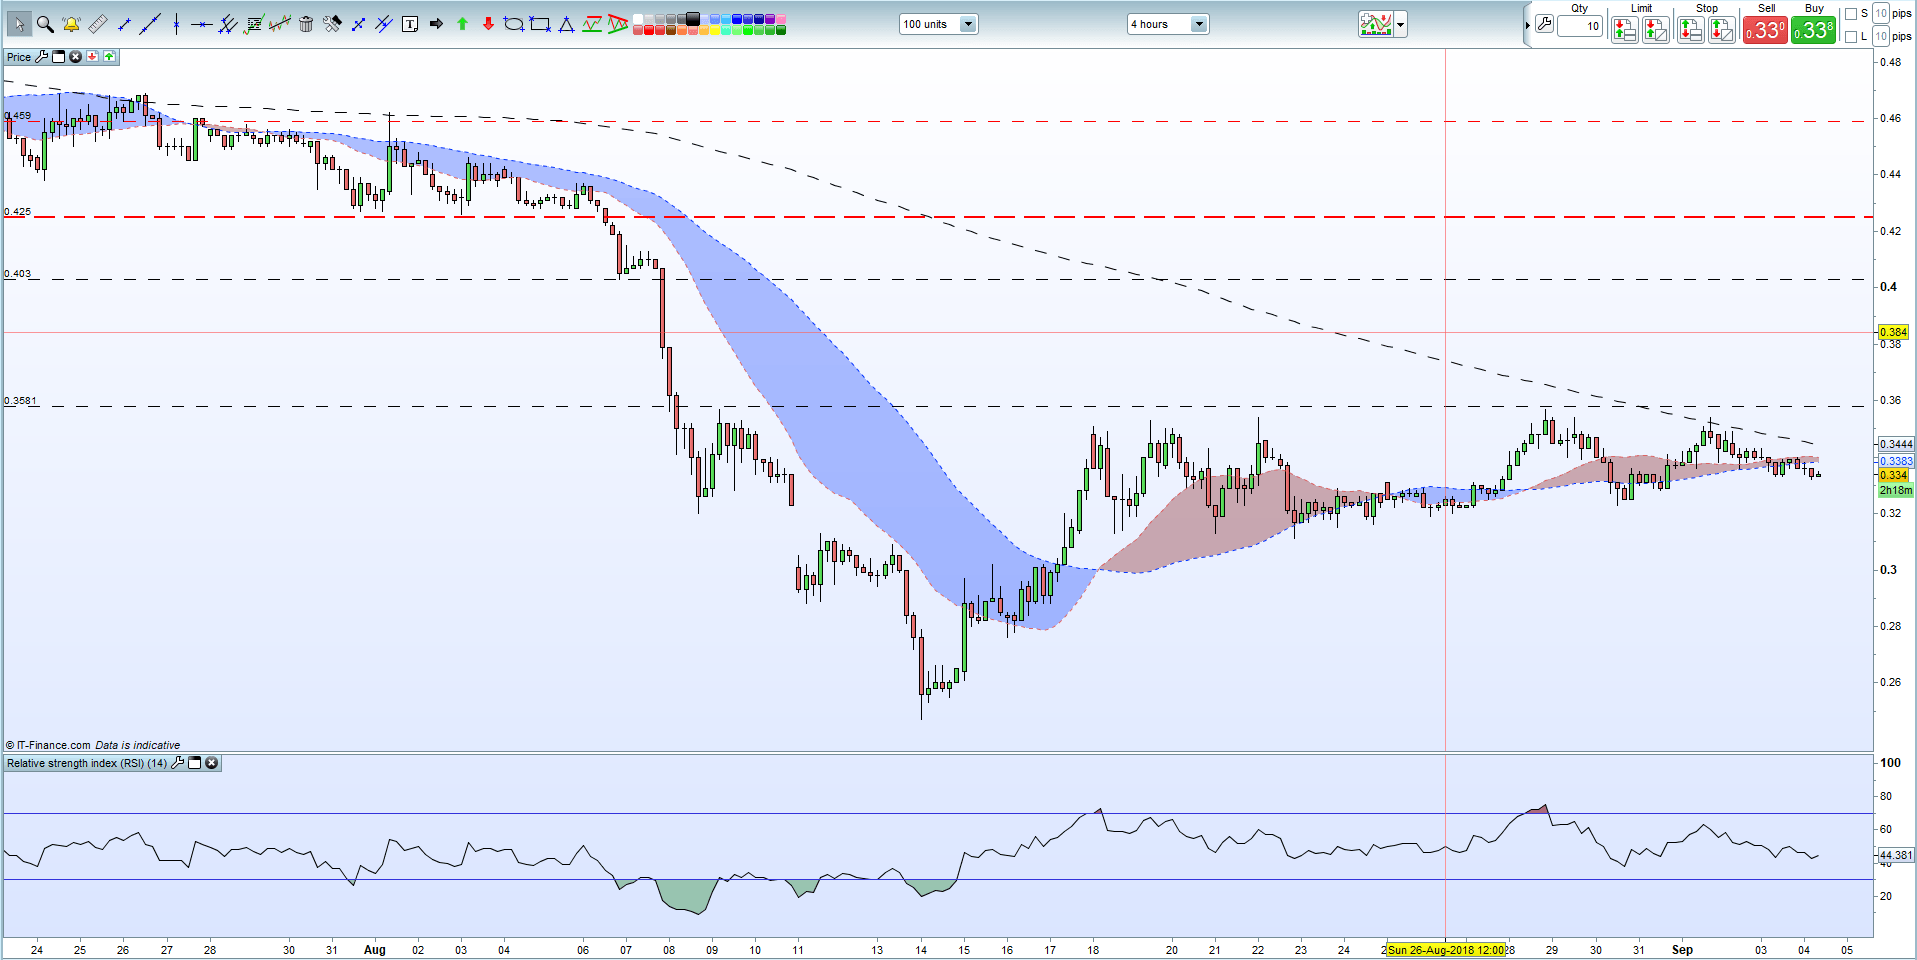
Ripple remains in a thin downtrend on the four-hour chart and below all three moving averages. Small candles highlight the lack of trade, or interest, in XRP while the RSI indicator sits mid-market and gives no clues to the state of the market. A break back into and above the gap on the chart between $0.36 and $0.40 is needed to give Ripple some further upside momentum.
IG Sentiment Data show how retail traders are positioned in Ripple, Ethereum and Litecoin and how changes in holdings can affect market sentiment and prices.
Ripple (XRP) Four-Hour Price Chart (July 23 – September 4, 2018)
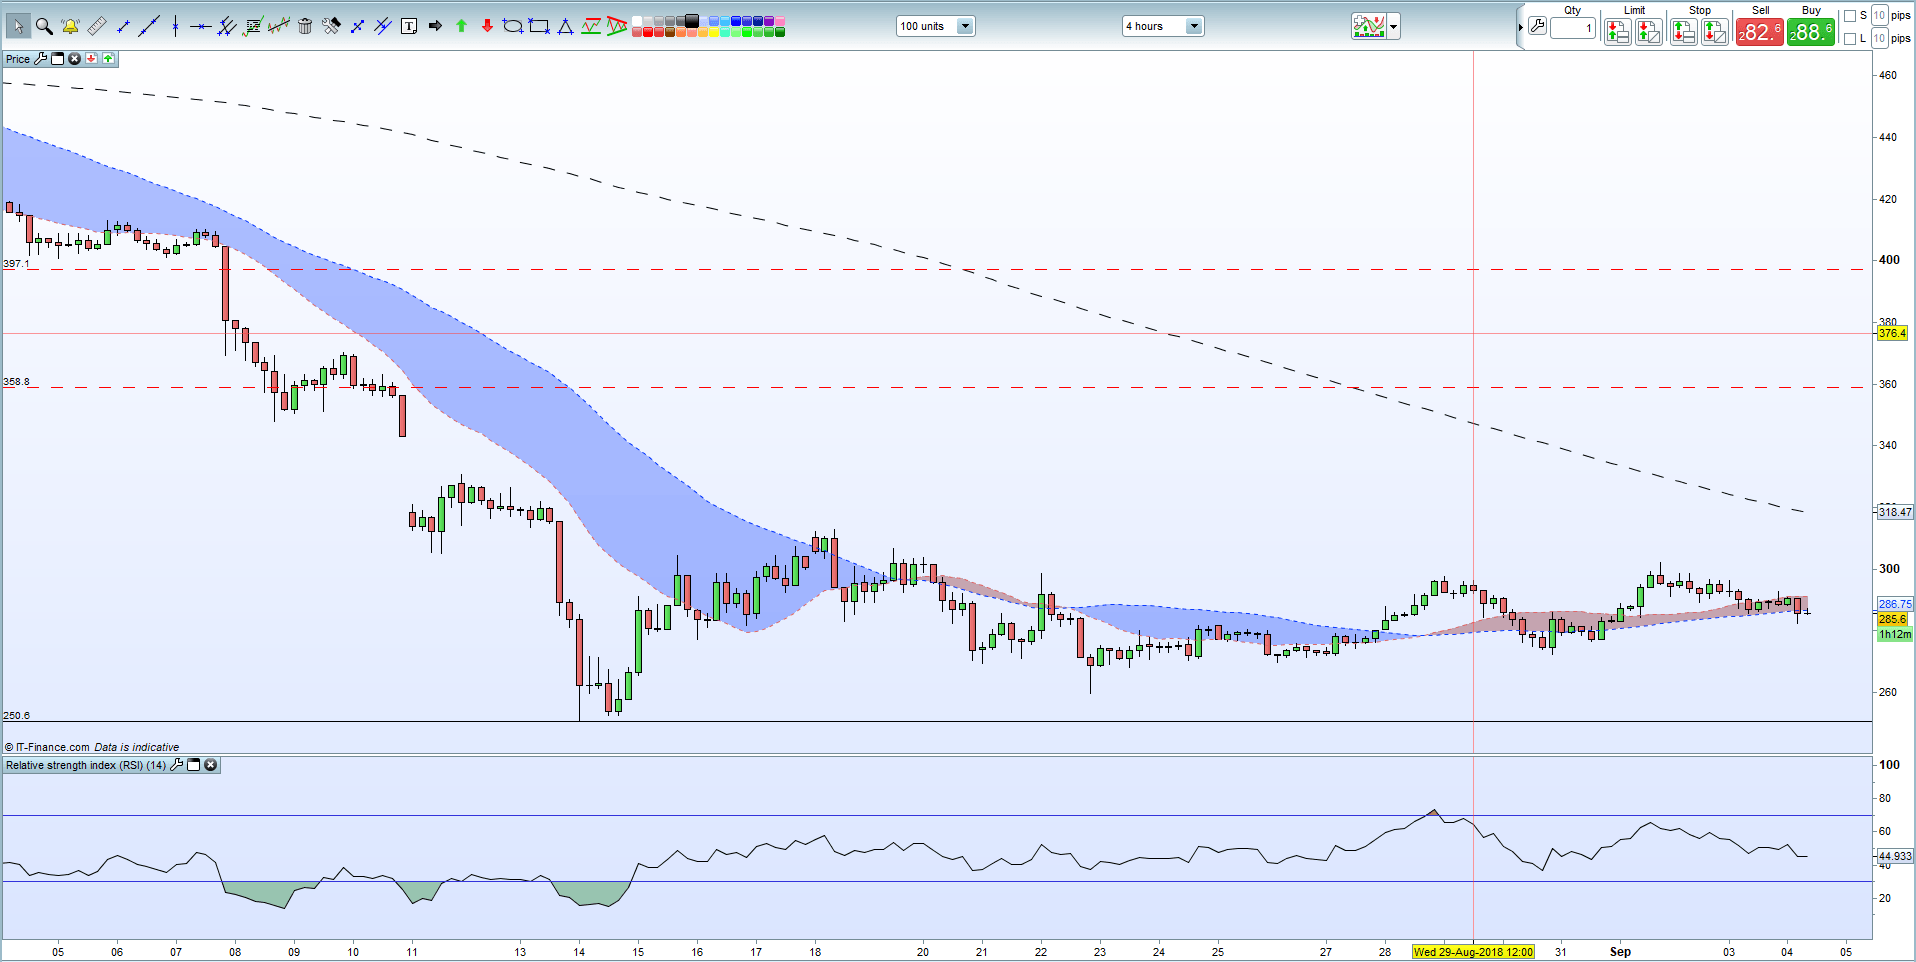
Ethereum, the second-largest crypotcurrency by market cap is also showing no signs of a move with the upside constrained by all three moving averages. The September 1 high pring at $302 is likely to cap any upside momentum in the short-term while the August 14 floor at $250 should limit any sell-off. Again, the RSI indicator gives no clues away.
Ethereum (ETH) Four-Hour Price Chart (August 3 – September 4, 2018)
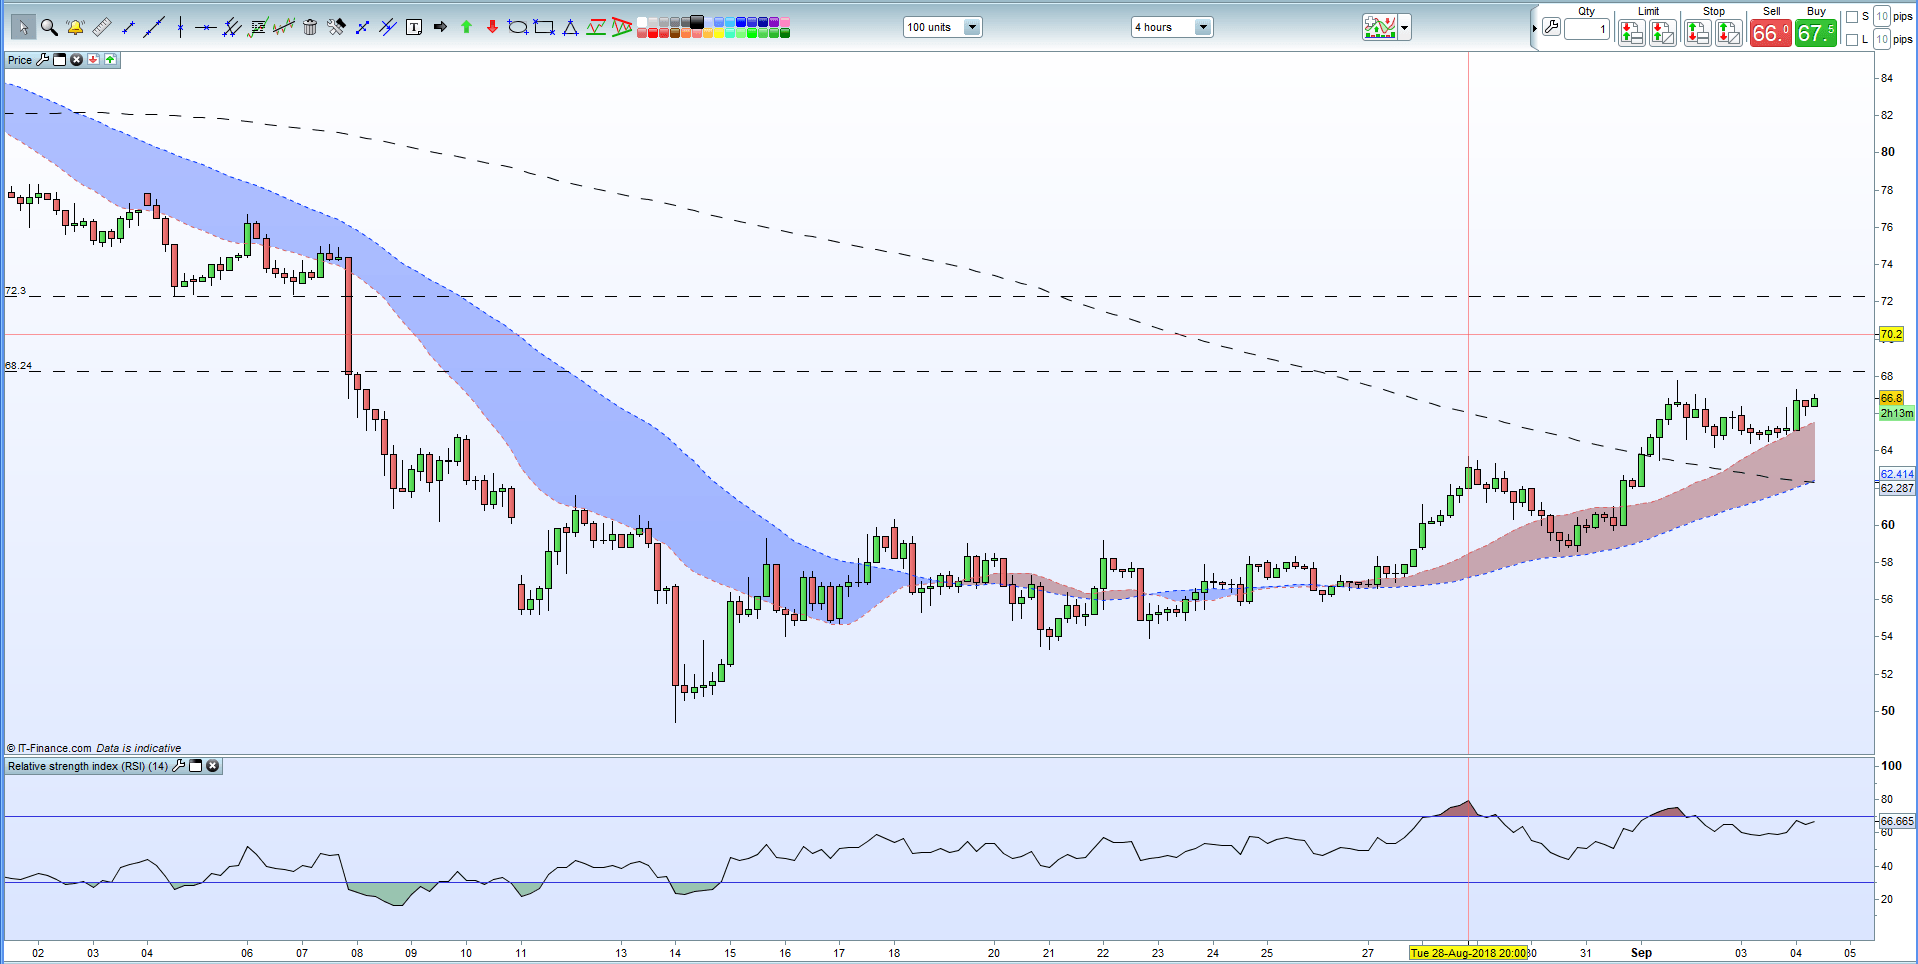
Litecoin’s four-hour chart is the most technically positive of all three with LTC above the 20-, 50- and 200-day moving average and nearing the $67.9 one-month high print. A break and close above could see the gap up to $72.3 filled opening the way higher. The 20- and 200-day moving average crossover at $62.4 should limit the downside.
Litecoin Four-Hour Price Chart (August – September 4, 2018)
We look at Bitcoin, Ethereum, Ripple, Litecoin and other cryptocurrencies at our Weekly Cryptocurrency Webinar every Wednesday.
Cryptocurrency Trader Resources
If you are interested in trading Bitcoin, Bitcoin Cash, Ethereum, Litecoin or Ripple we can help you begin your journey with our Introduction to Bitcoin Trading Guide.
What’s your opinion on the latest market (non-) moves? Share your thoughts and ideas with us using the comments section at the end of the article or you can contact me on Twitter @nickcawley1 or via email at nicholas.cawley@ig.com.
--- Written by Nick Cawley, Analyst.


