USDCHF – Price, Chart and Technical Analysis
- Heavy sell-off stalls for now.
- Fibonacci retracement and 200-day moving average may prove a difficult hurdle.
The latest IG Client Sentiment Indicator shows retail are currently 66.3% net long the pair, and combined with retail being further net-long long than yesterday and last week gives us a stronger-bearish contrarian indicator.
The DailyFX Q3 forecast and analysis of the USD is available to download here.
Swiss Franc Remains Bid on EM Woes, Trade Concerns
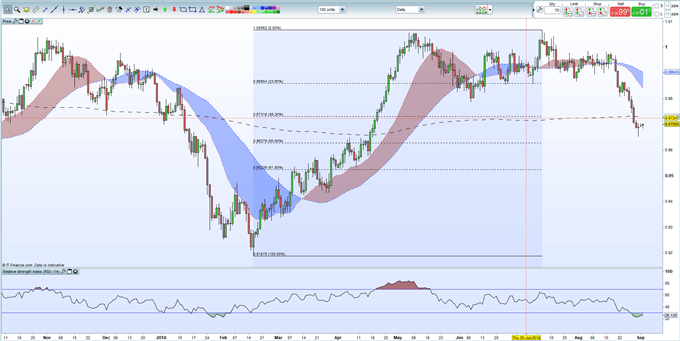
USDCHF currently trades either side of 0.9700, near its recent four-and-a-half month low, as the Swiss France retains its safe-haven bid, as EM currencies slump and trade tensions ratchet up. The sharp fall seen in the second-half of August has stopped for now with the pair trying to push back. On the daily chart USDCHF may encounter resistance around 0.97300 where the 38.2% Fibonacci retracement level meets the 200-day moving average. This level may prove difficult to overcome in the current risk-off environment and the pair may look at the 50% retracement of the February-July rally at 0.96279 as the next level of support.
The RSI indicator remains in oversold territory and may provide short-term support, although the IG Client Sentiment indicator is currently flashing a bearing signal for the pair. Today’s turnover is thinned by a US Bank Holiday and traders should wait until the US fully returns to the fray on Tuesday to see if chart resistance remains.
USDCHFDaily Price Chart (October 2017 – September 3, 2018)

If you are new to foreign exchange, or if you would like to update your knowledge base, download our New to FX Guide and our Traits of Successful Traders to help you on your journey.
What’s your opinion on USDCH and the latest EM sell-off?. Share your thoughts with us using the comments section at the end of the article or you can contact the author via email at Nicholas.cawley@ig.com or via Twitter @nickcawley1
--- Written by Nick Cawley, Analyst


