


Gold Price and US Dollar News and Analysis
- US Dollar finding support and may turn higher.
- Gold approaching Fibonacci resistance; RSI indicator at a four-month high.
The DailyFX Q3 Gold Forecast is now available to help traders navigate the market.
Gold Likely to Drift Lower as US Dollar nears Support
A tale of resistance and support as two of the most liquid financial assets continue to weigh on each other. The US dollar index – currently at 94.35 – is nearing strong support at 94.00 and may turn higher, putting pressure on the recent sharp gold rally. Monday’s news of a new trade agreement between the US and Mexico is supportive in the short-term for the greenback ahead of some heavyweight data releases later this week.

US Dollar Index (DXY) Daily Price Chart (February – August 28, 2018)
Gold and USDCNH Correlation Remains Intact
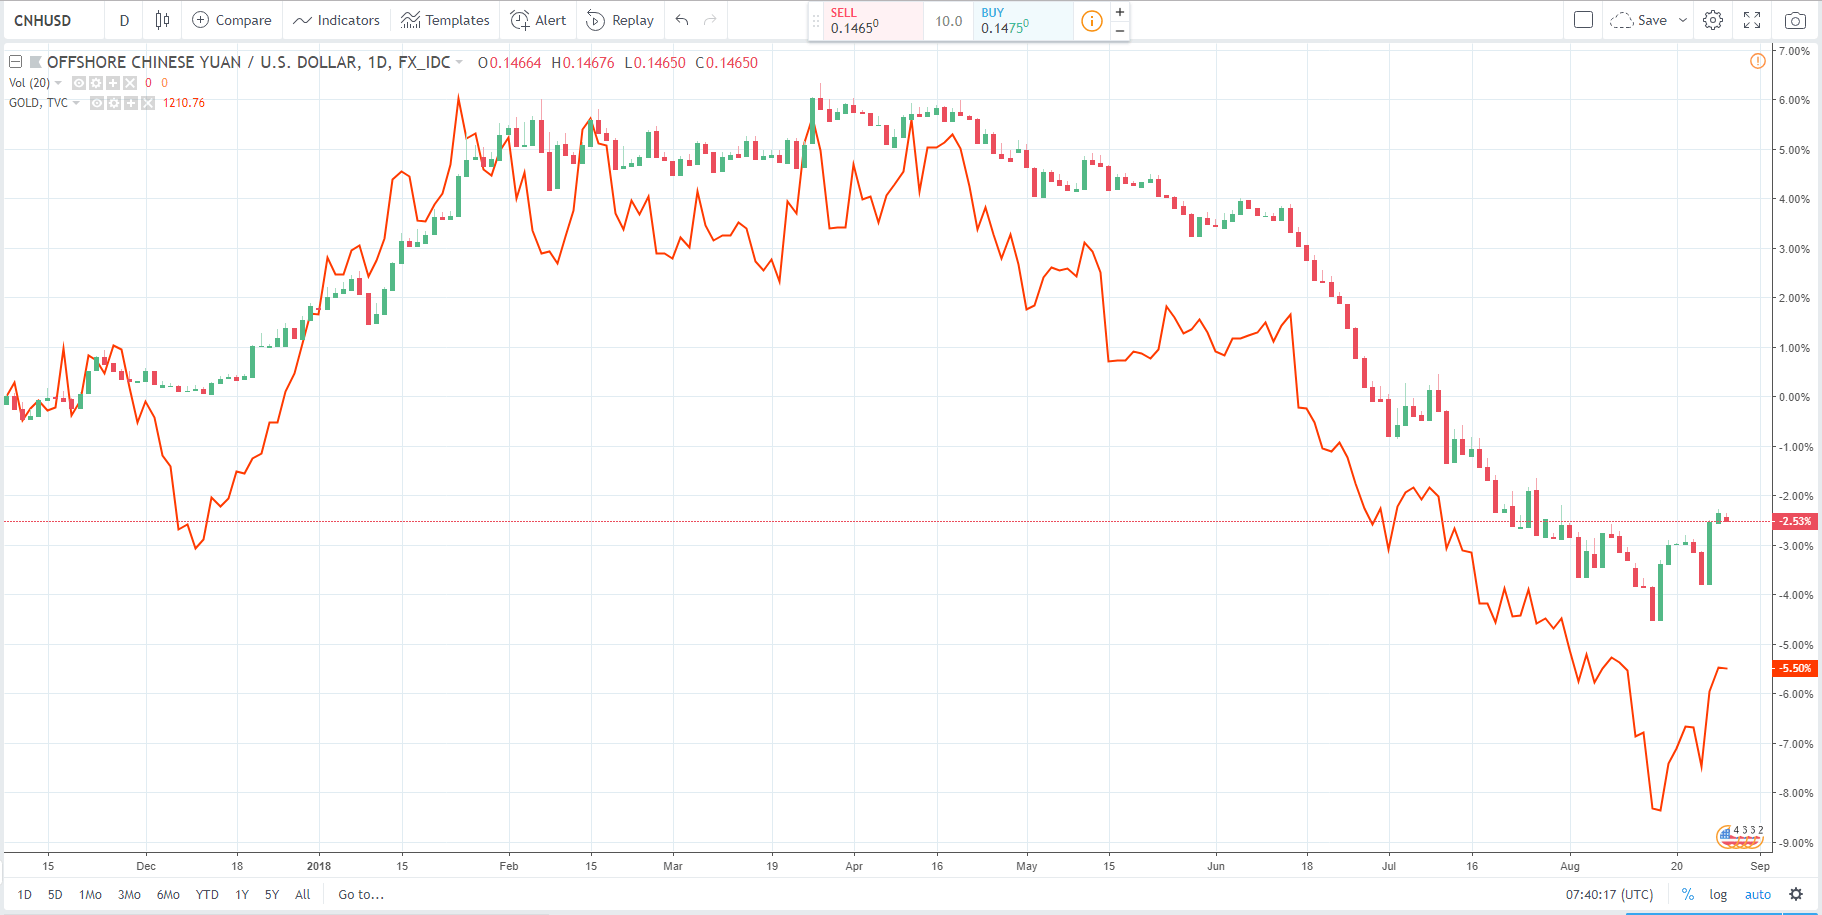
The latest gold rally has also been aided, and driven, by the turnaround in the Chinese Yuan’s fortune against the US dollar. After rallying from around USDCNH 6.20 to USDCNH 6.96 over the last four-months, the pair have turned lower, pushing gold higher.
Gold and Chinese Yuan Daily Chart (November 2017 – August 28, 2018)
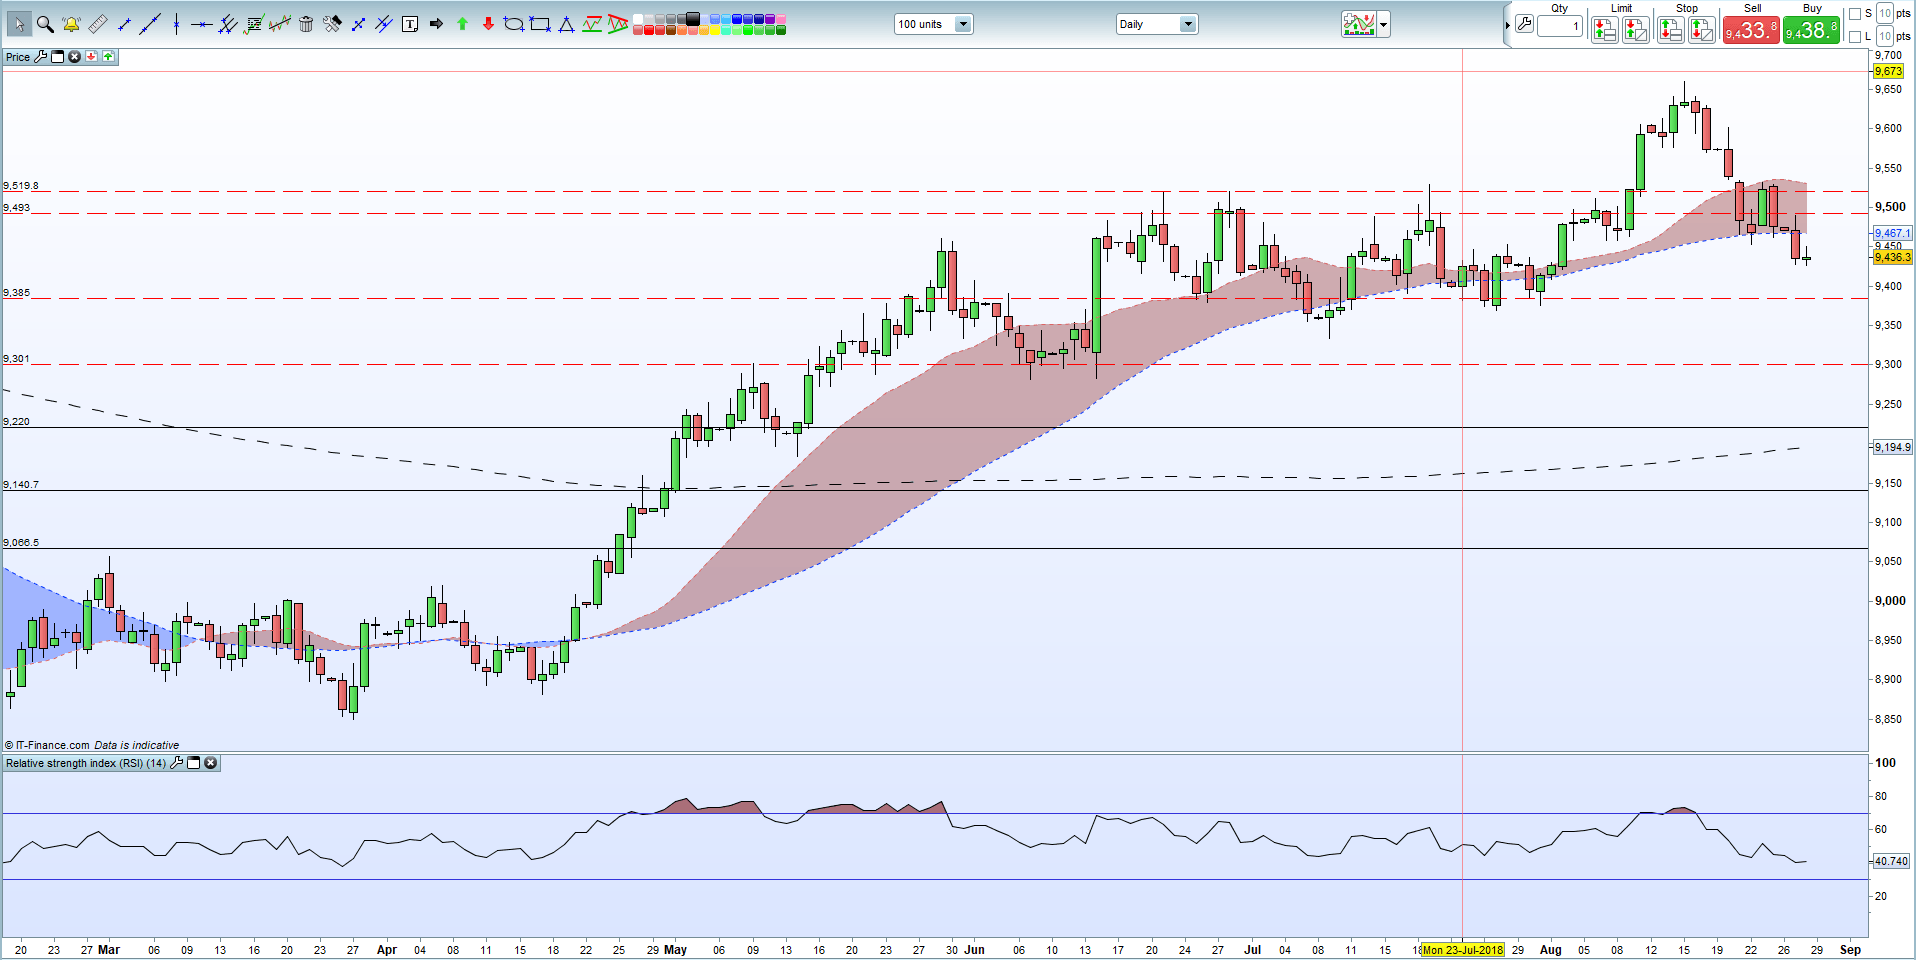
Gold is now approaching technical resistance and may struggle to close higher in the short-term. Fibonacci retracement at $1,215.4/oz. is close, while the 20-day moving average at $1,221/oz. will provide further resistance. A clean break and close above these levels will leave $1,236/oz. as a viable upside target.
A look at the RSI indicator also shows gold’s relative strength at a four-month high and inching towards overbought territory.
The latest IG Retail Sentiment Indicator shows that traders remain 83.2% net-long of the precious metal, normallya bearish contrarian sentiment indicator. However recent changes in client sentiment give us a mixed trading bias.
Gold Daily Price Chart (January – August 28, 2018)

Are you new to Gold trading or are you looking to improve your trading skill sets? We have recently produced an in-depth primer on How to Trade Gold: Top Gold Trading Strategies and Tips.
We are interested in your opinion and trading strategies for Gold, the US dollar and offshore Chinese Yuan – You canshare your thoughts, views or analysis with us using the comments section at the end of the article or you can contact the author via email at nicholas.cawley@ig.com or via Twitter @nickcawley1.
--- Written by Nick Cawley, Analyst


