


Asia & Pacific Market Open – NAFTA, Emerging Markets, S&P 500, Crude Oil, Yen, NZD
- Hopes of NAFTA deal b/w US and Mexico offered lift to emerging markets and S&P 500
- FOMC minutes further capped gains however, crude oil prices rallied as stockpiles fell
- Warning signs in the S&P 500 chart are present hint its next leg could be to the downside
Build confidence in your own trading strategy with the help of our free guide!
Global benchmark stocks rose during the latter half of Wednesday’s trading session, with gains capped towards the end of the day. The rally occurred amidst a rise in emerging markets. The MSCI Emerging Markets ETF (EEM) had its fifth consecutive daily winning streak, the longest in more than five months. Investors may have cheered prospects of a NAFTA deal between the US and Mexico to occur soon.
During the Asia/Pacific trading session, reports crossed the wires that this may come on Thursday. However, it was met with some skepticism. It was not until the US trading session that this seemed more likely to transpire. Mexico’s Economy Minister Jesus Seade spoke in Washington D.C. and noted that they are making good progress on NAFTA and that he is hoping for a solution very soon. The Mexican Peso appreciated.
However, the S&P 500 failed to achieve much upside momentum afterwards with gains paring further as the FOMC meeting minutes crossed the wires. While officials noted that a rate hike is anticipated ‘soon’, they highlighted some of the risks to the outlook which include: trade, housing and emerging markets. Following the document’s release, the US benchmark index declined along with government bond yields. This hinted at a partial flight to safety.
Crude oil prices also performed well. The sentiment-linked commodity not only rose with stocks, but also with the weekly US inventories report. There, stockpiles contracted by over 5.8m barrels which was much larger than the 2.0m decline expected. Gold, the anti-fiat unit, mostly traded sideways as the US Dollar finished the day little changed from yesterday.
The anti-risk Japanese Yen underperformed as global benchmark stocks generally rose throughout most of the day. Meanwhile, the sentiment-linked New Zealand Dollar outperformed (though strong retail sales data greatly contributed to its ascent earlier in the day). The similarly high-yielding Australian Dollar underperformed however, bogged down by political uncertainty and a government bond auction.
Ahead, a relatively quiet economic data offering during the Thursday APAC trading session leaves markets vulnerable to stray headlines that could suddenly impact market mood. This may come from trade war updates (the US is poised to impose $16b in tariffs against China on the 23rd while the latter is expected to retaliate). Given the mixed performance on Wall Street, stocks could consolidate next otherwise.
S&P 500 Technical Analysis – A Couple of Reversal Signs
While the S&P 500 has been in an uptrend since April when looking at this year, there are a couple of signs the index might fall next. For one thing, a shooting star bearish reversal pattern has formed after it failed to set a new record high on Tuesday. Second, negative RSI divergence shows that upside momentum is waning. While these do not guarantee that a reversal is imminent, they do offer early warning signals that do warrant caution. From here, near-term support is 2,801 while resistance is at 2,872.
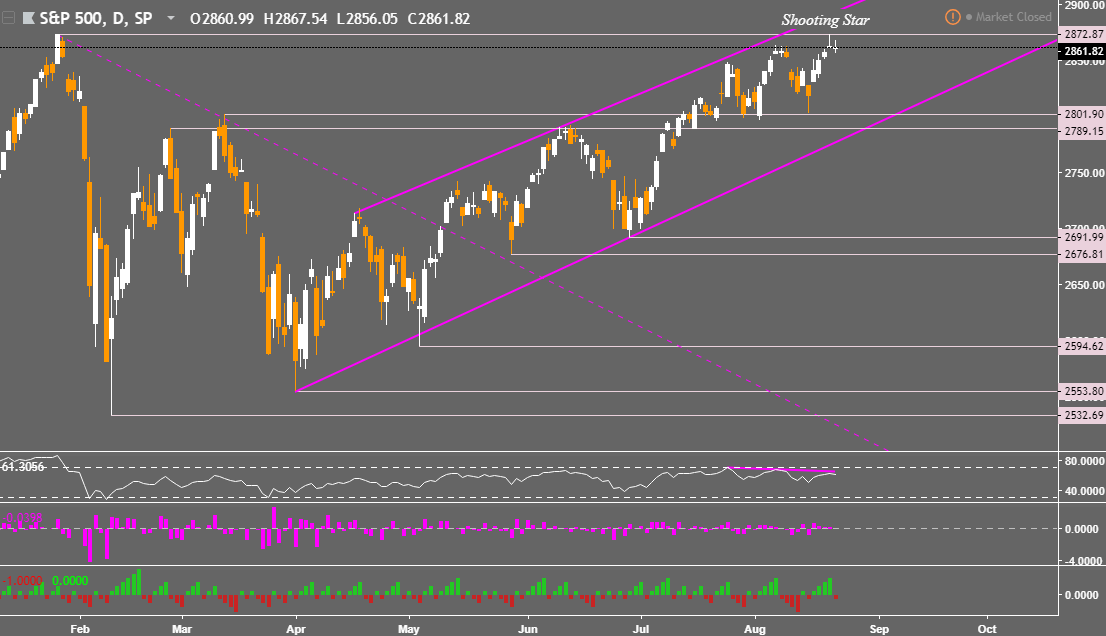
Chart created in TradingView
US Trading Session

Asia Pacific Trading Session

** All times listed in GMT. See the full economic calendar here
FX Trading Resources
- Having trouble with your strategy? Here’s the #1 mistake that traders make
- See how equities are viewed by the trading community at the DailyFX Sentiment Page
- Join a free Q&A webinar and have your trading questions answered
- Just getting started? See our beginners’ guide for FX traders
--- Written by Daniel Dubrovsky, Junior Currency Analyst for DailyFX.com
To contact Daniel, use the comments section below or @ddubrovskyFX on Twitter


