


Gold Price Analysis and Talking Points:
- Gold Losing Safe Haven Appeal to US Dollar
- Record Net Short Positioning Suggests Risks are for a Bullish Reversal
See our quarterly gold forecast to learn what will drive prices through mid-year!
Gold Price at Fresh 2018 Low as Safe Haven Appeal Dissipates
Gold has fallen further this morning, hitting its lowest level since March 2017 as investors flock to the USD following the ongoing rout in emerging markets, in which the Turkish Lira has yet again posted a fresh record low. This provides another sign that gold may indeed be losing its safe haven appeal with the USD seemingly in favour, which has also been reflected in regard to the trade war between the US and China, whereby the escalation in tensions has resulted in USD buying, resulting in downward pressure on commodities.
Beware of Bullish Reversal Amid Largest Net Short Positioning on Record
The negative sentiment in the gold has also been reflected in the latest CFTC data as hedge funds and money managers added 22k short gold contracts, making it the largest net short on record. This also surpasses the extreme short positioning seen at the end of 2015, which preceded the $300/oz bullish reversal in the precious metal over the following 7-months. As mentioned previously, given the record short positioning in gold, risks are most definitely skewed towards a bullish reversal. This has been further boosted by reports that long positioning has begun to stabilise with longs increasing over 3% since June 19th, suggesting that a bottom may be approaching, while shorts have increased by over 200% in the same period.
GOLD PRICE CHART: Daily Time-Frame (December 2016-August 2018)
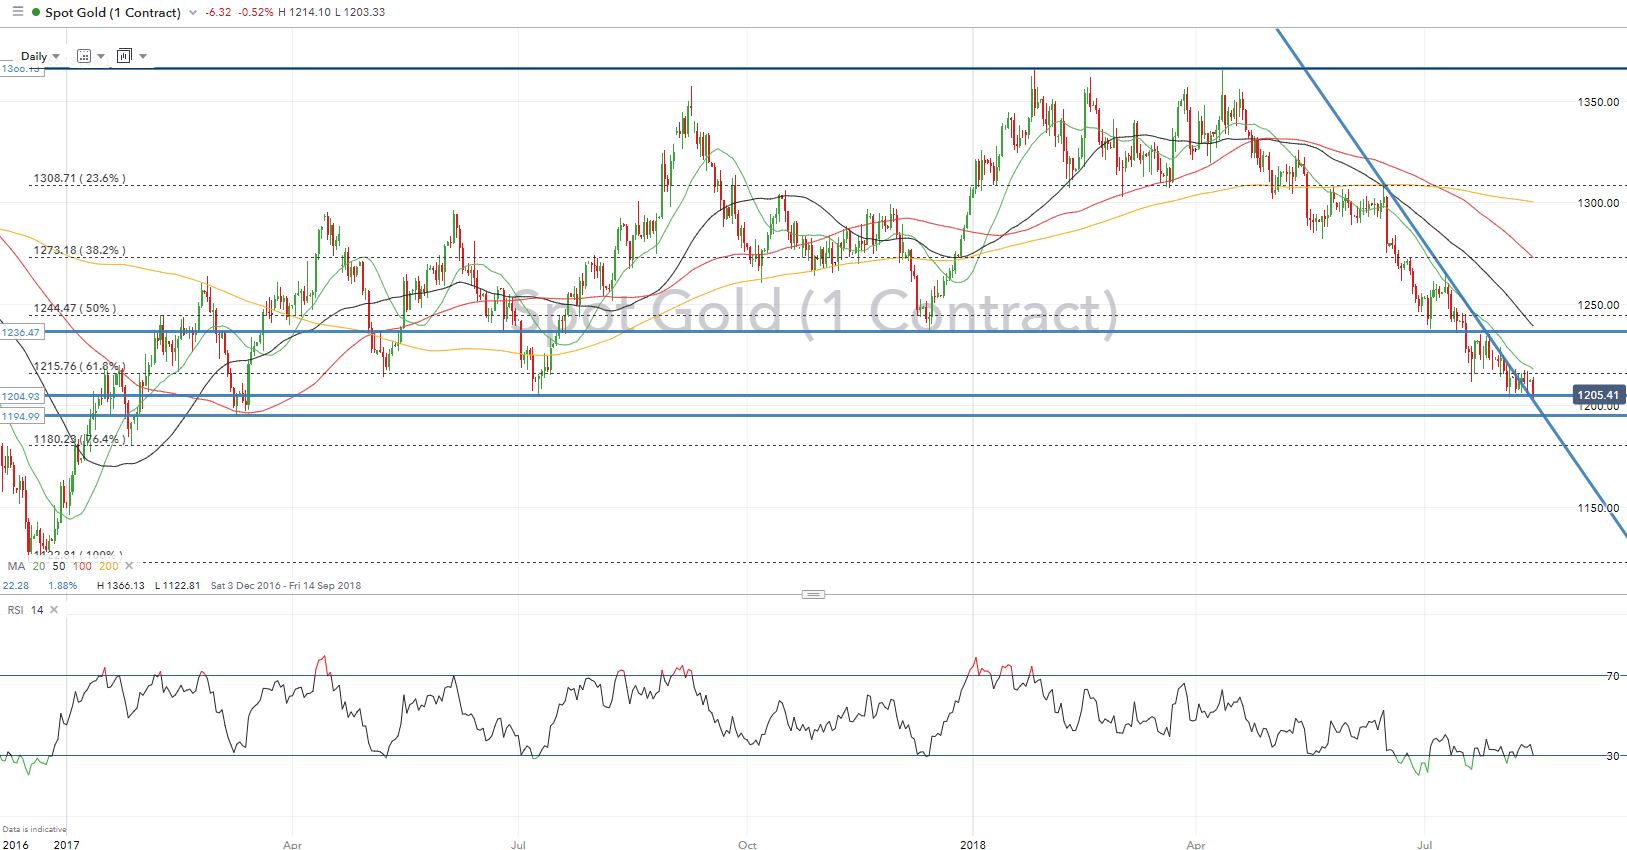
Since the 2018 peak in April, gold prices have fallen over 11%, which continues to hover above key support at the 1200/oz level. A break below will open up a move towards 1195/oz. However, the record net-short positioning provides us with a good indicator that risks are tilted to the upside, despite not providing a clear sign that prices have bottomed. On the upside, resistance is situated at 1215/oz.
Gold Technical Levels
S1: $1200 (Psychological)
S2: $1195 (March 2017 Low)
S3: 1180 (76.4% Fib)
R1: $1215 (61.8% Fib)
R2: $1236
R3: $1250
GOLD TRADING RESOURCES:
- See our quarterly gold forecast to learn what will drive prices through mid-year!
- Just getting started? See our beginners’ guide for FX traders
- Having trouble with your strategy? Here’s the #1 mistake that traders make
--- Written by Justin McQueen, Market Analyst
To contact Justin, email him at Justin.mcqueen@ig.com
Follow Justin on Twitter @JMcQueenFX


