


Crude oil price, news and analysis:
- The US crude oil price has risen as US sanctions on Iranian oil come closer.
- US inventories have fallen too.
- However, the oil price faces a major hurdle at the $70/barrel level.
Our trading forecasts for Q3 have been published; you can find the oil guide here.
And check out the IG Client Sentiment data to help you trade profitably.
US crude oil price could stall at $70
The price of US crude oil has been rising over the past few sessions as US sanctions on Iranian goods come into effect and traders eye the possibility of sanctions on Iranian oil, due to come into force in November.
In addition, the oil price has been helped by news that US inventories of crude oil fell by more than six million barrels last week, according to the American Petroleum Institute. A figure of around 3.3 million had been expected.
However, the price was modestly easier Wednesday ahead of official data from the US Energy Information Administration and it faces a significant barrier at the $70/barrel “round number”.
US Crude Oil Price Chart, Daily Timeframe (Year to Date)
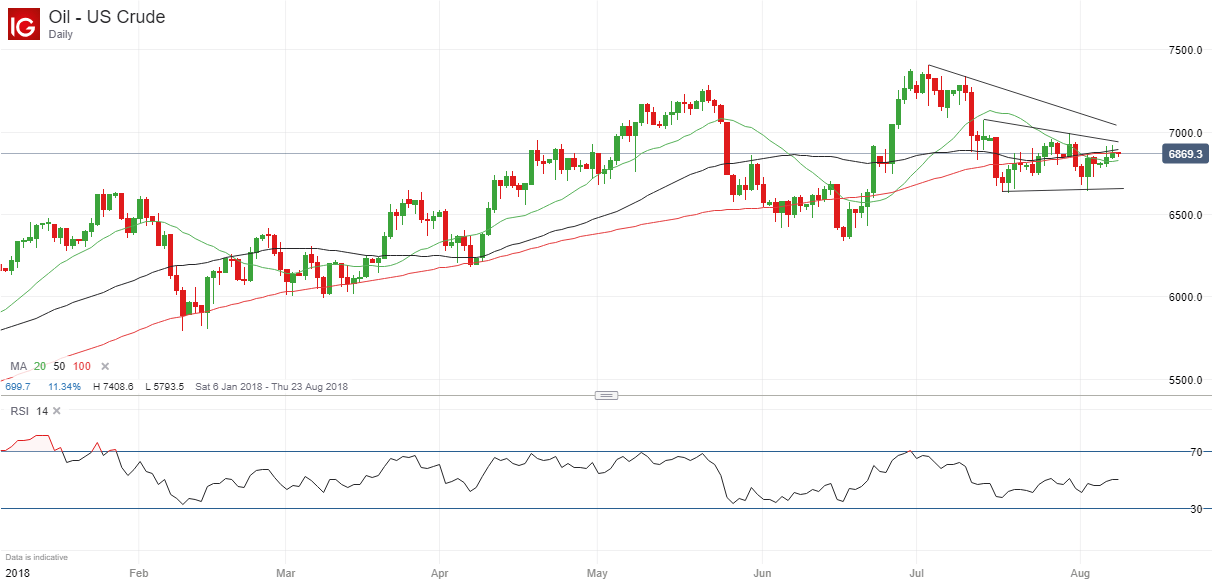
As the chart above shows, the crude oil price faces resistance from two separate trendlines just above and just below the $70/barrel level and they will be hard to breach,
Bearish trading bias
Meanwhile, retail trader data show 65.3% of traders are net-long, with the ratio of traders long to short at 1.88 to 1. In fact, traders have remained net-long since July 11, when the US crude oil price traded near $72.50; the price has moved 5.3% lower since then. The number of traders net-long is 2.7% higher than yesterday and 1.4% lower from last week, while the number of traders net-short is 0.3% lower than yesterday and 6.8% lower from last week.
At DailyFX, we typically take a contrarian view to crowd sentiment, and the fact traders are net-long suggests crude prices may continue to fall. Traders are further net-long than yesterday and last week, and the combination of current sentiment and recent changes gives us a stronger bearish contrarian trading bias.
Resources to help you trade the markets
Whether you are a new or an experienced trader, at DailyFX we have many resources to help you: analytical and educational webinars hosted several times per day, trading guides to help you improve your trading performance, and one specifically for those who are new to forex. You can learn how to trade like an expert by reading our guide to the Traits of Successful Traders.
--- Written by Martin Essex, Analyst and Editor
Feel free to contact me via the comments section below, via email at martin.essex@ig.com or on Twitter @MartinSEssex


