


Bitcoin, Ethereum, Ripple: Prices, Charts and Analysis
- Bitcoin (BTC) small bounce off support but sub $6,000 levels are expected.
- Ripple (XRP) has no technical support until early-mid $0.20s
- Ethereum (ETH) needs to hold $359 or sub-$300 levels come into play.
IG Client Sentiment Report shows that retail investors are 76% net-long of Bitcoin, a bearish contrarian indicator. See how daily and weekly holdings move and how they affect investor sentiment.
Bitcoin, Ethereum, Ripple – Cryptocurrency Market Crushed
A sea of red in the cryptocurrency space after an announcement from the SEC that it was delaying a decision on a Bitcoin ETF (Van Eck/SolidX) for another month sent prices pinning lower. Yet the decision - purely procedural - was expected by many in the market, prompting questions over the severity of the sell-off. The cryptocurrency market has been weak across the board in recent days with support levels falling with ease and rebounds sold into.
The latest sell-off has seen around $25 billion wiped off the cryptocurrency market capitalization, which now stands at $232 billion, down from a $810 billion+ peak at the height of the crypto craze in January. Double-digit losses were also made by a wide range of alt-coins, giving back a majority of their recent gains.
We will be covering Bitcoin, Ripple, Ethereum and a range of other cryptocurrencies, at our Weekly Cryptocurrency Webinar on today (Wednesday) at 12:00pm.
Bitcoin (BTC) Looking to go Below $6,000 Again
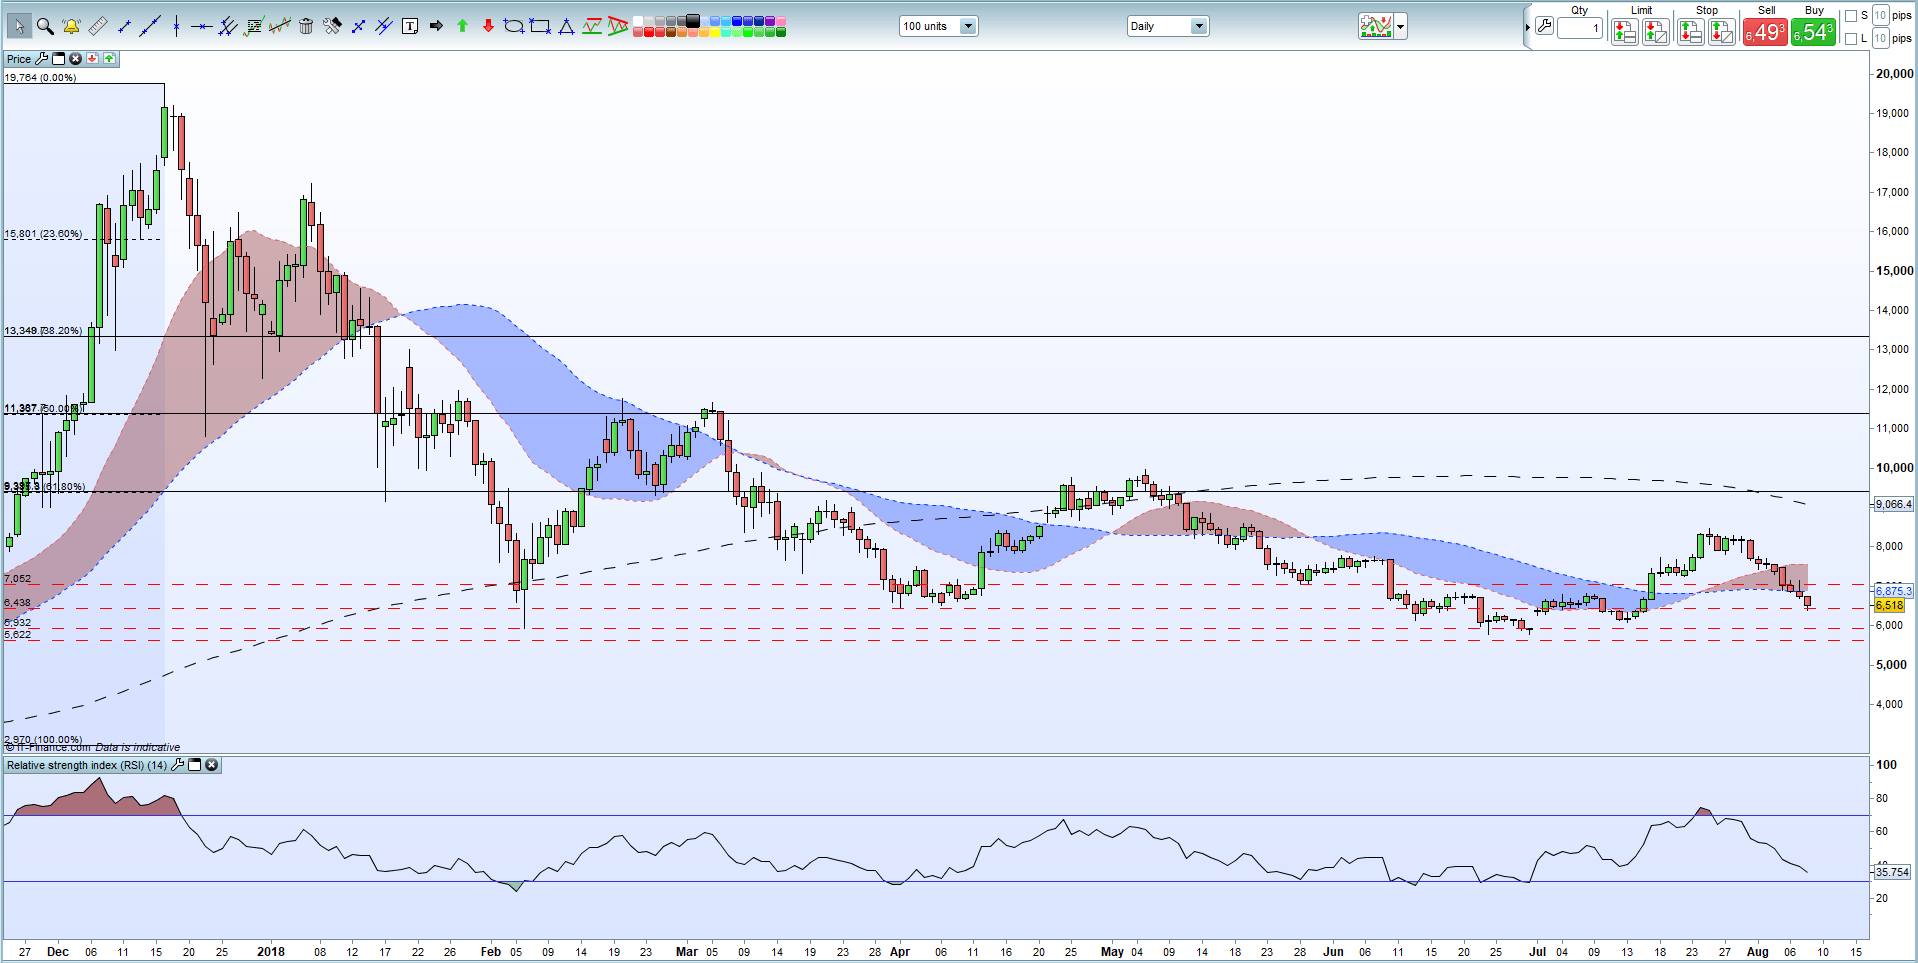
The chart below shows a classic head and shoulders pattern taking place in the largest crypto, suggesting lower prices ahead. A close below $6,438 will leave the market looking at $5,932 and $5,622 and both levels could be made quickly if the negative sentiment persists.
Bitcoin Daily Price Chart (December – August 8, 2018)
Ripple (XRP) Fall Accelerates – Little Support Seen
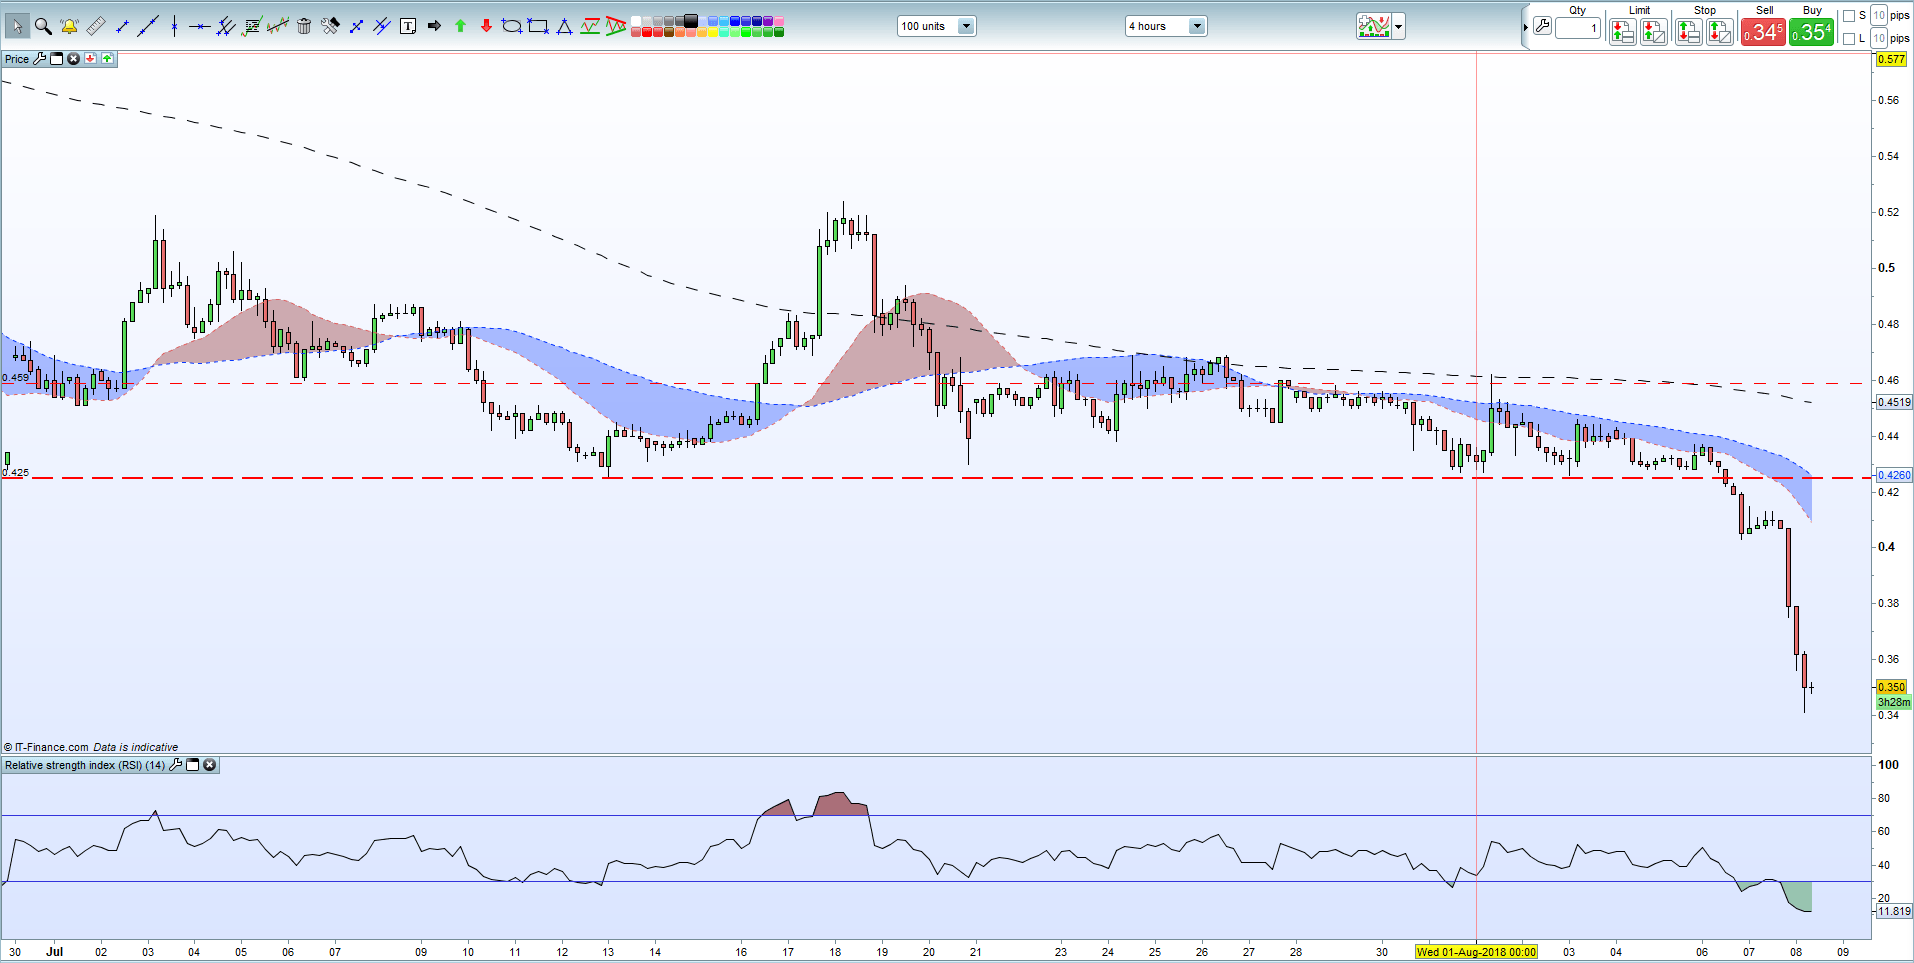
Ripple has slumped overnight, breaking noted support at $0.425 with ease. The four-hour chart set-up shows little or no technical support and we need to go back to December 12 to find potential support. There is a gap on this candle between $0.35 and $0.28 which needs to be filled with the next level of any technical significance the start of the XRP rally – all the way up to $3.30 - at $0.205.
Ripple Four Hour Price Chart (June – August 8, 2018)
Ethereum (ETH) Sell-Off Needs Next Support to Hold
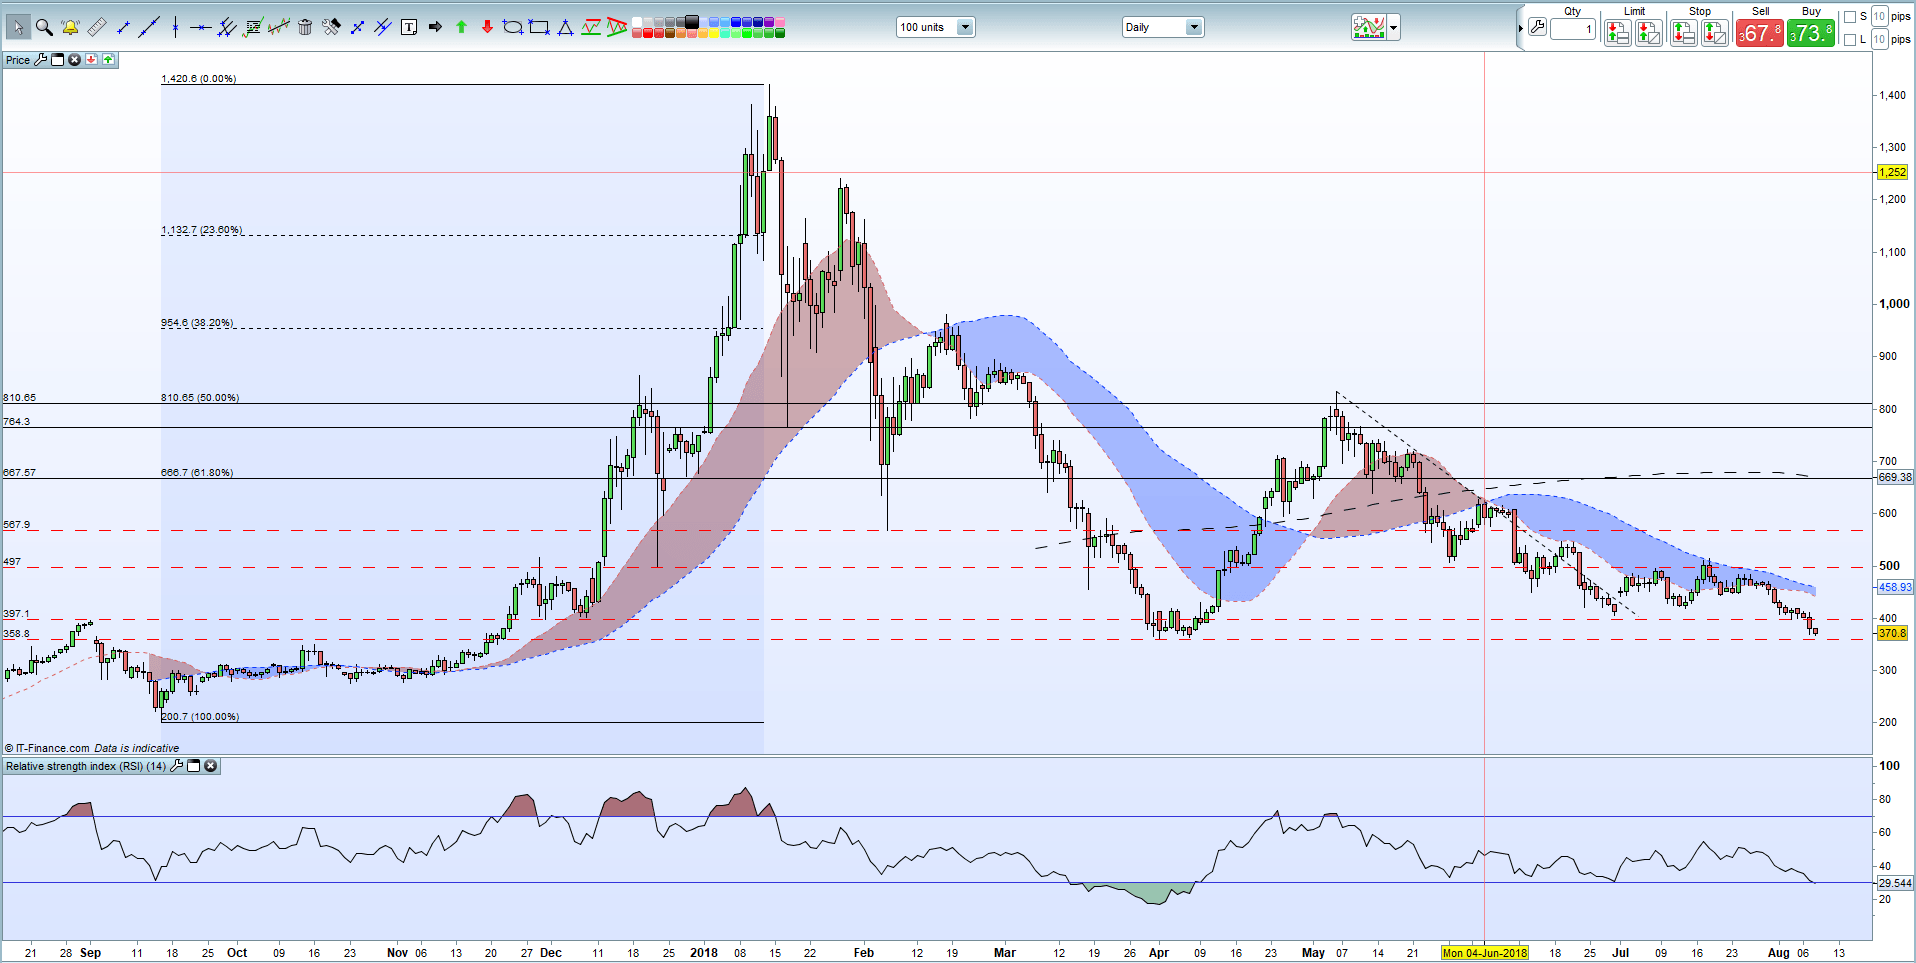
Another crypto nearing an important support level with ETH looking at the $359 double-low made on April 1 and April 6 as the last line of defense until lows between $280 and $260 made at the end of last year come into play. There is also a strong possibility that ETH may give back all of its September - January rally and trade back around $200.
Ethereum Daily Price Chart (September 2017 – August 8, 2018)
You can contact me on Twitter @nickcawley1 or via email at nicholas.cawley@ig.com.
--- Written by Nick Cawley, Analyst.


