See our 3Q forecasts for the US Dollar, Oil and Equities in the DailyFX Trading Guides page
Key US Session Developments – CAD, Oil, TSX Composite, AUD/CAD
The Canadian Dollar was the worst performing FX major, depreciating heavily during the second half of Tuesday’s trading session. This was despite a rise in local government bond yields, which signaled firming BoC rate hike expectations ahead of this week’s Canadian jobs report. Data out of the country has been tending to outperform as of late, opening the door for an upside surprise there on Friday.
Rather, the sentiment-linked Loonie was under pressure as the TSX Composite Index (which was closed for a holiday on Monday) gapped higher and declined 0.81% on Tuesday. The stock index amplified its descent after Canadian Ivey PMI clocked in at 61.8 in July from 63.1 in June which was its lowest since March. Since a reading above 50 indicates expansion of purchasing activity, that rate effectively slowed down.
Meanwhile a US Dollar pullback during the second half of the day (after falling earlier) also weighed against CAD. Crude oil prices, which the Canadian Dollar sometimes closely follows, also pared gains despite renewed sanctions on Iran from the US. In addition, oil remained under pressure even though API estimated US weekly stockpiles contracting 6.02m bbl last week.
Oil being unable to capitalize on these updates may have been a reflection of other key developments. Yesterday, Saudi Arabia reported that it sent the most crude to the United States since 2017. Meanwhile, China (who is the largest buyer of Iranian oil) agreed to maintain current import levels despite US demands to reduce purchasing from Iran. The two largest economies are in the middle of trade spats.
The sentiment-linked Australian Dollar also outperformed, largely rising during the first half of the day as Asia/Pacific shares traded higher. This was also when we saw some greenback weakness. This combination thus sent AUD/CAD shooting for the stars on Tuesday. The pair rose 0.84% to its highest daily close since July 26th. It was also its strongest upside performance in a single day since June 4th.
A Look Ahead – Trade Wars, RBA, Philip Lowe, AUD
The improvement in market mood on Tuesday could echo into Wednesday’s Asia/Pacific trading session. This could have bearish implications for the anti-risk Japanese Yen and bullish impacts for the sentiment-linked AUD and NZD. However, escalating trade tensions between the US and China still poses as a risk for equities.
During the early hours of Wednesday’s Asia session, the US went ahead with slapping tariffs of 25% on $16b of Chinese goods which will take effect on August 23rd. This is the second portion of the $34b in US tariffs enacted on China back on July 6th. Moreover, the world’s second largest economy is poised to proceed with retaliating and this could weigh on stocks ahead.
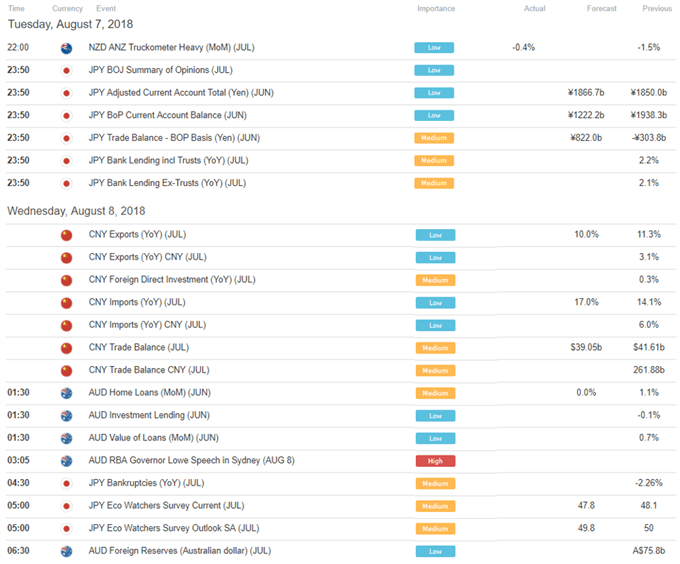
We will also get a speech from RBA’s Governor Philip Lowe after yesterday’s central bank interest rate announcement. There, the Australian Dollar saw some small gains in the aftermath as the RBA forecasted inflation being higher in the long-run. Traders will be tuning in to Mr. Lowe’s speech for further details and how CPI could impact the timing of their anticipated hike later on in 2019.
DailyFX Economic Calendar: Asia Pacific (all times in GMT)

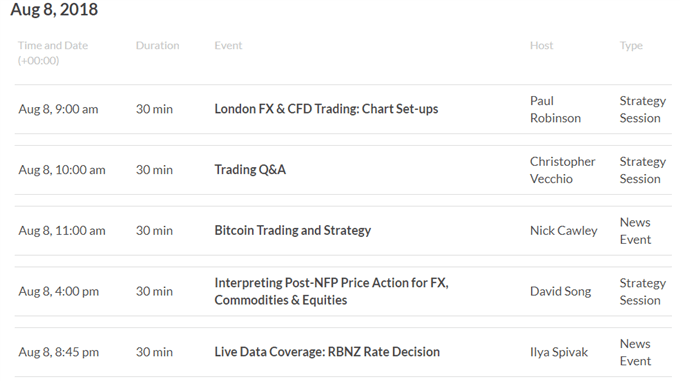
DailyFX Webinar Calendar – CLICK HERE to register (all times in GMT)

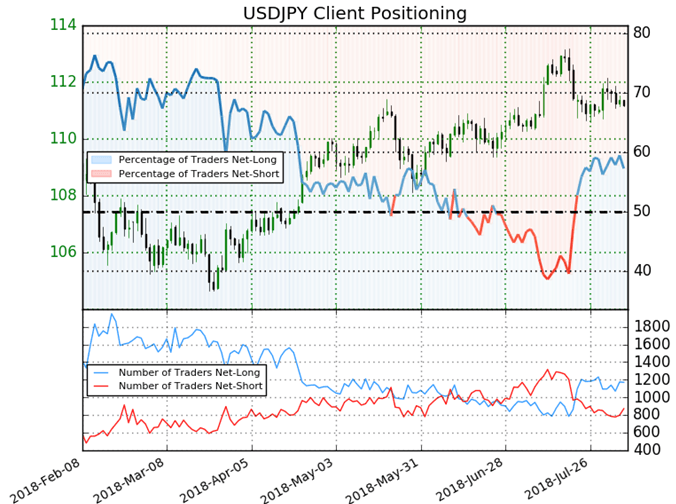
IG Client Sentiment Index Chart of the Day: USD/JPY

CLICK HERE to learn more about the IG Client Sentiment Index
Retail trader data shows 57.3% of USD/JPY traders are net-long with the ratio of traders long to short at 1.34 to 1. In fact, traders have remained net-long since Jul 23 when USD/JPY traded near 111.332; price has moved 0.1% lower since then. The number of traders net-long is 4.3% higher than yesterday and 7.0% lower from last week, while the number of traders net-short is 5.8% higher than yesterday and 11.9% higher from last week.
We typically take a contrarian view to crowd sentiment, and the fact traders are net-long suggests USD/JPY prices may continue to fall. Yet traders are less net-long than yesterday and compared with last week. Recent changes in sentiment warn that the current USD/JPY price trend may soon reverse higher despite the fact traders remain net-long.
Five Things Traders are Reading:
- US Dollar Technical Analysis: Big Test At Long-Term Resistance by Tyler Yell, CMT, Forex Trading Instructor
- US Dollar Pulls Back Shy of Yearly Highs to Catch Support at 95.00 by James Stanley, Currency Strategist
- XAU/USD Technical Outlook: Gold Prices Digest Recent Losses by Michael Boutros, Currency Strategist
- USD/JPY: Sentiment Prompts a Bearish Bias as Support is Tested by Jake Schoenleb, DailyFX Research Team
- Gold Carves Narrowing Range Following Failed Run at July 2017 Low by David Song, Currency Analyst
--- Written by Daniel Dubrovsky, Junior Currency Analyst for DailyFX.com
To contact Daniel, use the comments section below or @ddubrovskyFX on Twitter


