


Bitcoin and Ripple: Prices, Charts and Analysis
- Bitcoin (BTC) will struggle to keep upward momentum going.
- Ripple (XRP) breaks through significant support and should fall further in the coming weeks.
IG Client Sentiment Report show retail are 77% long of Bitcoin – normally a contrarian bearish signal – but recent daily and weekly changes suggest that Bitcoin may rise further in the short-term. Download the report to see how it can help you make more informed trading decisions.
Bitcoin (BTC) Rebound will be Shallow and Short-Lived
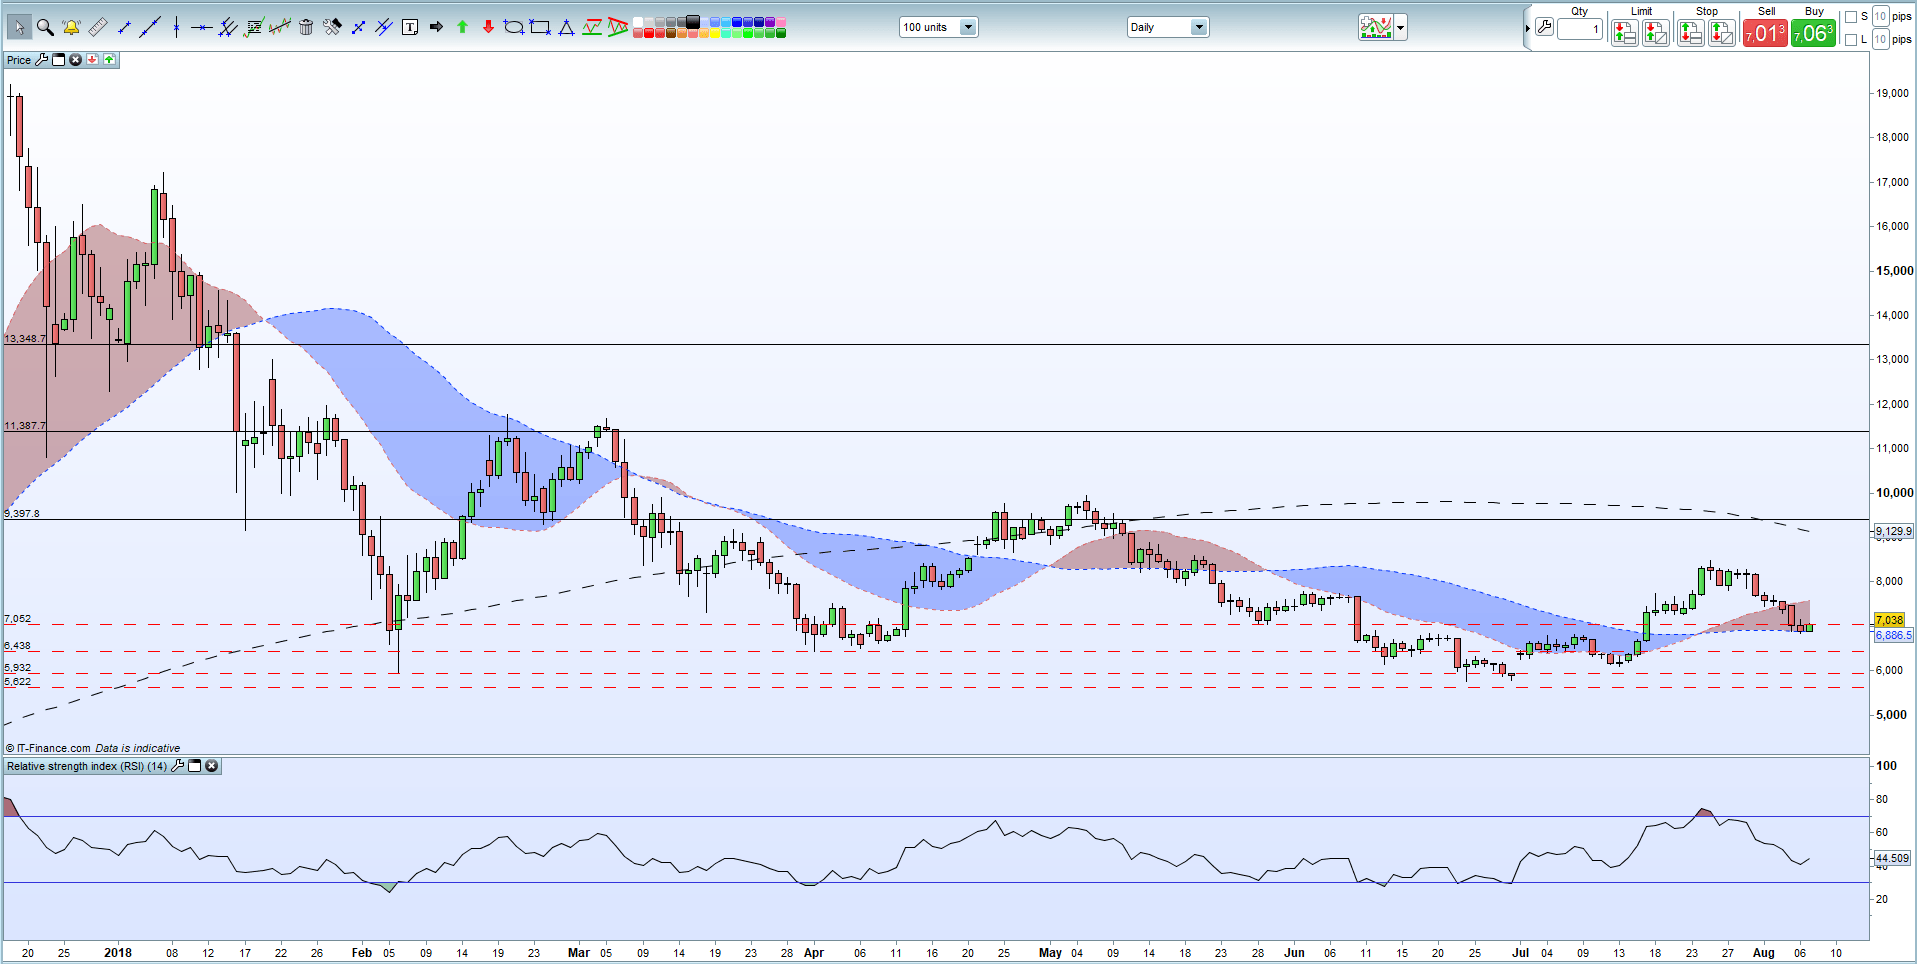
After falling around 20% in the last two weeks, Bitcoin has picked up a bid at the lower levels and crept back above $7,000, but the move looks weak and unlikely to continue. A ‘head and shoulders’ chart formation is taking shape which suggests a break lower soon, while BTC trades below the 20- and 200-day moving average and just a fraction above the 50-day ma. Initial support will be found around $6,438, before $5,932 and $5,622 come into play.
Bitcoin Daily Price Chart (December 2017 – August 7, 2018)
Ripple (XRP) Breakdown Continues
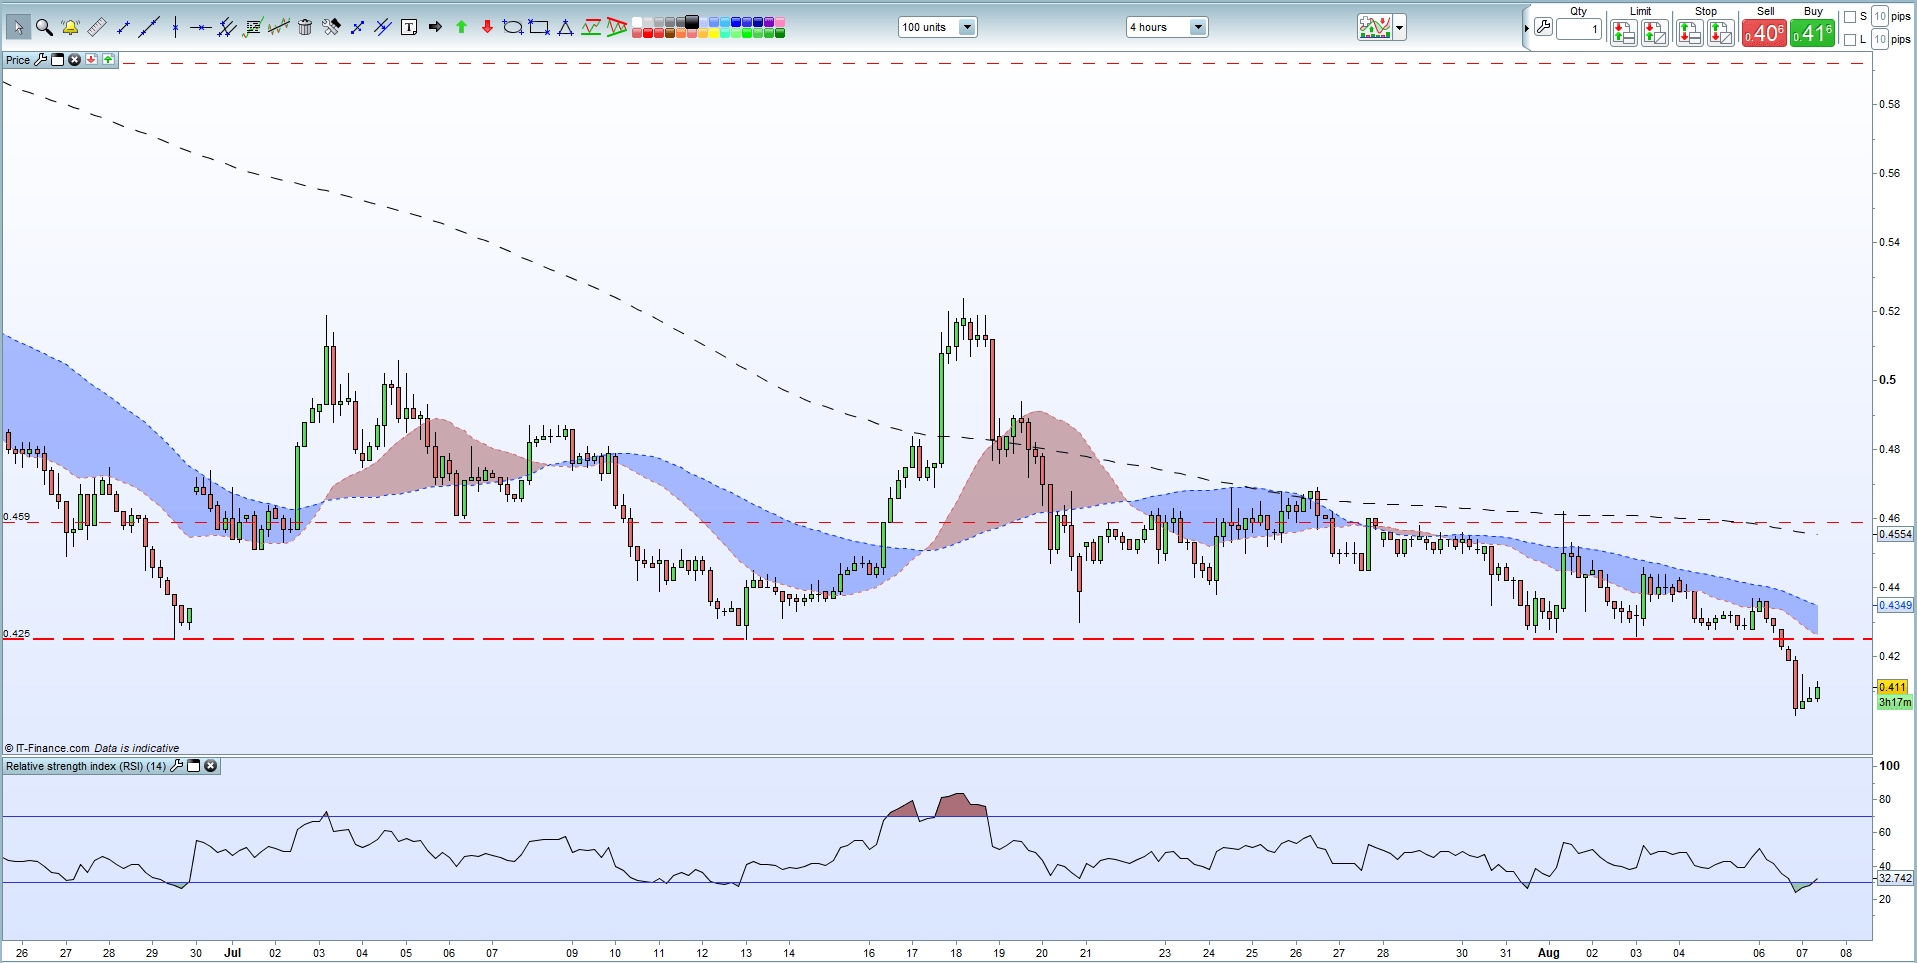
Ripple has broken through noted support at $0.425 leaving the way open for further, heavy falls back to levels seen at the end of last year. The support level, made of a double low on June 29 and July 13 this year has acted as support for the last week, but Monday’s breakdown leaves little support for the third largest cryptocurrency.
Ripple (XRP) Four Hour Price Chart (June 25 – August 7, 2018)
A look at a longer time frame shows that support does not come into play until around $0.25 -$0.27 level, highs seen in mid-to late-November last year before the rally to $3.25 took off. The token trades below all three moving averages, although the RSI indicator points to consolidation/small rebound in the short-term.
Ripple (XRP) Daily Price Chart (November 2017 – August 7, 2018)

We cover Bitcoin, Ripple and a range of other cryptocurrencies, at our Weekly Cryptocurrency Webinar on Wednesday at 12:00pm.
You can contact me on Twitter @nickcawley1 or via email at nicholas.cawley@ig.com.
--- Written by Nick Cawley, Analyst.


